Overview
Abstract
The Engine is a fully customizable collection of physiologic systems. It includes models for anatomy-based biological systems and medical equipment. We developed an advanced engine through a top-down approach, with the ability to easily increase fidelity and manipulate system models. It can be integrated with other software and hardware platforms and devices.
Introduction
Computational modeling and analysis of the human physiology is extremely useful for various applications. There are many approaches for simulating the body's response to various stimuli. Some existing software uses state-based calculation that can only provide a limited amount of data, by way of preprogrammed responses. Complex interactive effects are difficult with this approach because it uses additive or purely multiplicative responses.
Some existing high fidelity models use more complex computational fluid dynamics (CFD). One major drawback of this approach is the significant computation resources required. Cellular, molecular, and genetic models are difficult for whole body physiology. Using this low-level individual cell and receptor methodology often does not provide the level of data a clinician requires for informed decision-making. Physiologically-based pharmacokinetic (PBPK) modeling focuses only on drug interactions, and is generally designed to deal with specific pathophysiology.
The engine is designed to be a deterministic multiscale modeling application that can be integrated with all other types of physiologic software. Models at any anatomical level can be implemented within the existing infrastructure.
 Figure 1 The engine uses a top-down approach to model development with bottom-up hooks for expansion.
System Design
Background and Scope
Physiology Engine
The engine is the combination of lumped parameter mathematical models that, together, simulate whole body physiology. Each system contributes to the maintenance of homeostasis. The systems are designed to be modular and each has the ability to work in isolation. They are all reliant on the Common Data Model (CDM) connections and leverage several generic solvers and transport algorithms.
The system as a whole needs to be easy to use and modify, modular, and extensible to virtually any fidelities. Envisioned end user groups include game developers, mannequin builders, educators, researchers, sensor system developers, and trainers. Several of these users utilize the engine in a way that requires faster than real time processing without access to computational resources that exceed a personal computer.
Sub-Systems
Below is a list of the current systems with links to their methodology reports:
Physiologic:
- Blood Chemistry Methodology
- Cardiovascular Methodology
- Drugs Methodology
- Endocrine Methodology
- Energy Methodology
- Environment Methodology
- Gastrointestinal Methodology
- Nervous Methodology
- Renal Methodology
- Respiratory Methodology
- Tissue Methodology
Equipment:
- Anesthesia Machine Methodology
- Inhaler Methodology
- Bag Valve Mask Methodology
- Mechanical Ventilator Methodology
- Electrocardiogram (ECG) Methodology (see Cardiovascular Methodology)
- Supplemental Oxygen Methodology (see Respiratory Methodology)
Environment:
Solvers
The engine of also comes with verified tools for extensibility and elimination of potential error sources:
Data Flow
The engine uses differential equations with control-based feedback mechanisms to dynamically respond to parameter changes. It is designed and tuned around a stable resting physiologic state, with the ability to model pathophysiology through insults and intervention action calls. Many of the system circuit elements are modified based on substance concentrations and external action (i.e., insult and intervention) modifiers. The Respiratory System transfers substances back and forth to the Cardiovascular System using Alveoli Transfer. Equipment circuits are directly connected to other systems through an inter-circuit connection. The current implementation creates a combined circuit for analysis; therefore, the combined circuit is calculated as one large circuit with a single fluid. Substance transport also occurs in combined compartment and link graphs.
Timing
The entire engine works off of a transient analysis time step of 0.02 s (50 Hz). All system states are recalculated every time step. The differential equations that determine changes are linearized to approximate system variables, but the small time step provides a very accurate solution.
To provide the systems with sufficient information, the CDM maintains three time steps for elements and parameters. These times are:
- Baseline - The original resting physiology set-point. Baseline values are often assigned by the patient parameters. These values generally only change hen conditions are applied.
- Current - The time step that has already been calculated. The current values are used to determine the values for the next time step elements based on system feedback mechanisms.
- Next - The next values are what will be used to calculate the system state on the next process call.
Stabilization
The engine stabilizes with a multi-step process. The engine must be initialized and reach a stable state prior to modifying the patient condition. This is completed by using a dynamic stabilization protocol to execute the engine until a specified set of criteria are met, then any patient chronic conditions are applied. These conditions modify patient parameters and model values to represent the new patient state. The engine must restabilize using the dynamic protocol to achieve a stable state. This process is outlined in Figure 2.
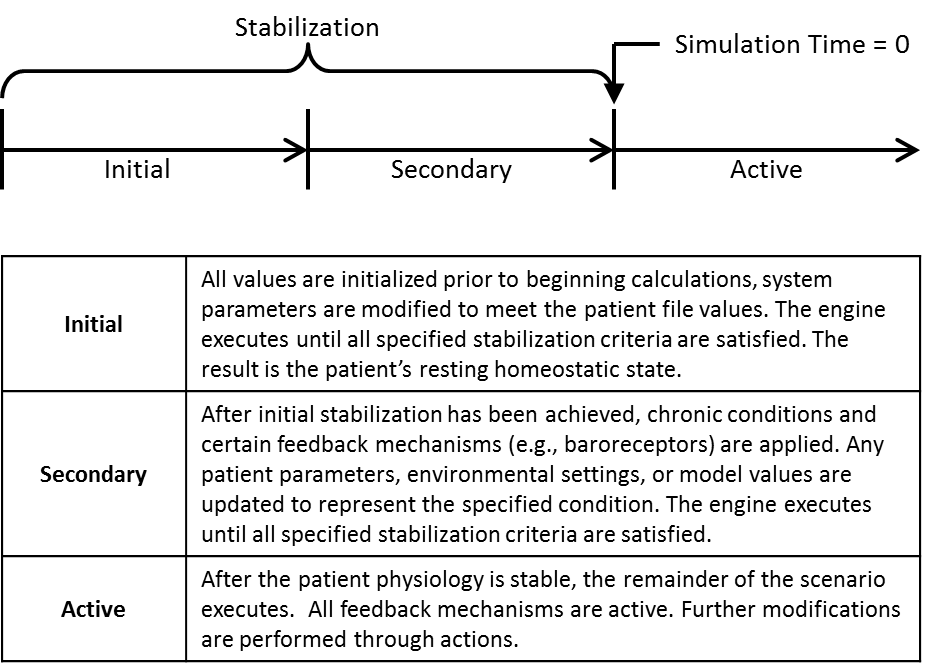 Figure 2 Overall the engine stabilization protocol. This highlights the multi-step process required to initialize either a healthy or chronically ill patient prior to executing a scenario.
Dynamic Stabilization
The engine must perform numerous cycles of the calculations to reach a point of convergence for the output values, such as heart rate, tidal volume, systolic pressure, etc. When the engine has reached this convergence point, it is considered to be stable. During the stabilization period, the majority of feedback in the engine is inactive. An exception is the Tune Circuit methodology found in the Cardiovascular System. This modifies the cardiovascular circuit parameters to achieve the mean arterial pressure specified in each patient file. For more information on this function, see the Cardiovascular Methodology. No actions or conditions can be applied during the stabilization time. Because the patient parameters may vary in the patient file, the time required for the solution to converge may vary. By using a dynamic stabilization algorithm, the engine will be fully initialized and the solution will have converged at the conclusion of the stabilization period for any patient. This stabilization algorithm also prevents an unnecessarily long time for a solution that may be required in the time that were statically specified for all scenarios and patients.
To determine the convergence time, the engine uses a dynamic stabilization algorithm. The stable outputs were analyzed to determine the variation present in each individual output over time. This percent variation was identified for the key outputs in each system. The percent difference between the current time step and the next time step is calculated for output. The percent difference calculated must be less than the identified convergence criteria for the output. This must be maintained for the convergence time. This time is specified at approximately seven respiratory cycles (at 16 breath/min -> ~25 seconds). The respiratory cycle was chosen because it is the has the longest period. Convergence should occur over the longest periodic cycle in the engine to ensure variation is not at a low frequency.
Currently, the convergence criteria and time are specified in the CDM. In the future, the algorithm implementation will remain in the CDM, but the convergence criteria (including time) will be moved to an XML file, similar to patient and substance files, for easy manipulation by the user (see PatientData and SubstanceData for more information).
Conditions
Patient conditions that are persistent or recurring are chronic conditions. The human body responds differently to chronic conditions than it does to acute conditions. While the body is in an altered state, which may be weaker, the body's response to the condition becomes damped over time. In short, the body reaches a new level of homeostasis that may not be considered healthy, but does not have the same continual feedback mechanisms operating that occur when acute conditions cause a deviation from homeostasis.
To implement these conditions in the engine, a two step stabilization process was implemented. As discussed above, the dynamic stabilization criteria was required to ensure all outputs converged prior to performing any actions (insults or intervention) in a given patient. This is true for conditions, as well. However, after a condition is applied the solution must again converge to represent the body's new homeostatic state, that while different from the healthy homeostasis, is still a stable patient state.
The same convergence methodology is used for this second convergence. However, a set of convergence criteria for the outputs must be specified for each condition. This criteria reflects the new variation in outputs over time that may exist during the condition. Examples of these conditions are anemia, pericardial effusion, and arrhythmias. More information on these can be found in the Cardiovascular Methodology.
There is no limit on the number of conditions that can be applied at one time. However, testing an validation of outputs when combining conditions has not been performed. In the future, when a user applies multiple conditions, a merging algorithm will be used to combine the convergence criteria. This will specify the least stringent requirements as the final convergence criteria for the combined conditions.
Preprocess
Preprocess is called for each system individually and is generally used to modify the circuit elements based on feedback mechanisms and actions. This is also where any system drivers are determined for the upcoming time step, such as the heart contractility or ventilatory drivers.
At the start of every Preprocess step, the next time step circuit element values are initialized to the stored baseline values. Generally speaking, elements are updated by getting the next value and using multipliers before setting it again. This allows for the "stacking" of modifiers and the ability to alter the same element based on any number of mechanisms.
Process
Process generally determines the entire next time step circuit state. The generic circuit solver is leveraged to automatically calculate unknown circuit variables. Substances are also transported throughout and between systems with general equations - usually based on path flows or absorption and diffusion coefficients and renal and hepatic clearance factors.
Postprocess
Postprocess advances time by moving the next time step values to the current time step values. The next values are then set to the baseline values in preparation for the upcoming Preprocess call.
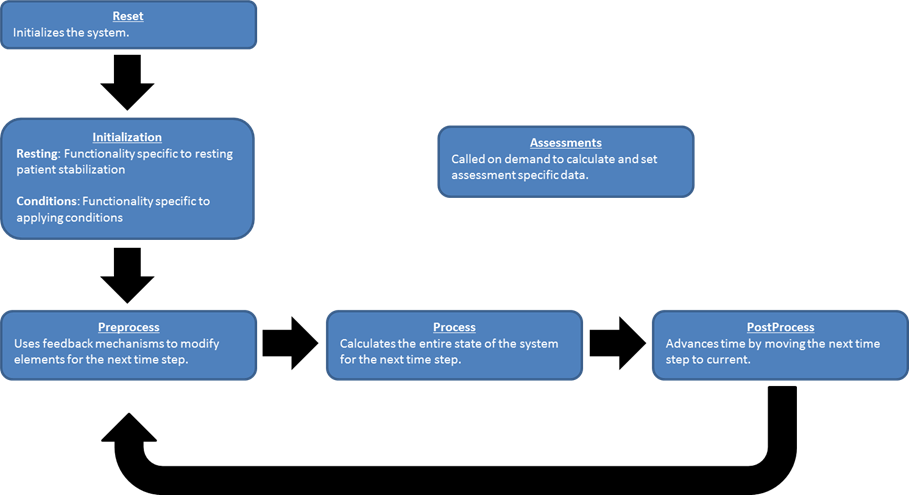 Figure 3 This shows the repetitive three-step process used each time step to determine the system states. These three processes are mirrored in each system's code and are sequentially called by the engine.
Interface
Externally available data is defined within the engine in three major ways:
- System data
- Similar to vitals
- Set individually within the system classes at each time step
- Example: heart rate
- Compartment data
- Anatomical definitions
- Mapped/assigned nodes and paths from which to draw information
- Theoretically encompasses any number of circuit nodes and paths
- Example: trachea oxygen partial pressure
- Assessments
- Data collected and packaged to resemble a report or analysis that might be ordered by a physician
- Intended to give general patient overviews
- Calculated on demand
- Example: Complete Blood Count
The engine modeling approach takes the human body and conceptually divides it into various fluid compartments that represents a real division in terms of how portions of the body's water, solutes, and suspended elements are segregated [303]. Compartments can be further discretized into smaller sub-compartments with a hierarchical relationship as you drill into various systems. In the engine, compartments can be defined to encapsulate circuit nodes that allow easy organization, access, and synchronization of all system parts.
Compartments are implemented as conceptual physical divisions of the body. Anatomical data can be pulled from each compartment through optional node and path mapping. Compartments can be further discretized into smaller sub-compartments with a hierarchical relationship as you drill into various systems. In engine, compartments can be defined to encapsulate circuit nodes that allow easy organization, access, and synchronization of all system parts. Figure 4 shows an example of how compartments can be defined in the Cardiovascular System.
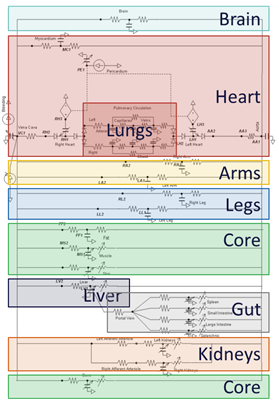 Figure 4 This is an example of possible Cardiovascular System compartments. This is for explanation purposes only and not necessarily indicative of how things are really defined. See the Cardiovascular Methodology documentation for how they are really defined.
Users can customize scenarios by modifying a variety of file types. For example, patients, substances, compound substances, and environments can all be modified via the text files provided. This allows users to customize scenarios by tailoring patients and environmental conditions to the specific circumstances of the user. As an example of this flexibility, the code base contains a variety of patient files. These parameters in these patient files can be specified to represent different physiologic states for a patient. See Patient Methodology for details.
For more details on interfacing with the engine, see the engine documentation.
Assumptions and Limitations
The engine uses a low fidelity clinical approach and is not necessarily for high fidelity predictive purposes. It is also assumed to be contained within the CDM.
See the individual system methodology documents for more specifics.
Results and Conclusions
Combined Effects Validation
Several scenarios have been developed and validated to ensure proper interaction not only within, but also between the physiologic systems. These patients and scenarios were developed as part of the HumanSim: Sedation and Airway project funded by TATRC, contract number W81XWH-11-C-0045. The combined effects scenarios were validated qualitatively from available literature and from the opinions of subject matter experts (SME). More detail on patient parameters can be found in the Patient Methodology documentation. A summary of the validation is shown in Table 1. Green indicates good agreement with validation data, yellow indicates agreement with a general trend with some minor disagreement, and red indicates a disagreement with the validation data. The number indicates the number of output parameters for each category of validation success or failure.
| Key |
|---|
| Good agreement: correct trends or <10% deviation from expected |
| Some deviation: correct trend and/or <30% deviation from expected |
| Poor agreement: incorrect trends or >30% deviation from expected |
| Scenario | Description | Good | Decent | Bad |
|---|---|---|---|---|
| Cynthia | Midazolam is injected causing an airway obstruction. Oxygen is supplied via a mask. Ketamine is administered and the airway obstruction is cleared. Rocuronium is administered. An endotracheal tube is set. | 28 | 2 | 0 |
| Hassan | Oxygen is administered via a mask. Ketamine and succinylcholine are administered and the mask is removed. Right mainstem intubation occurs. The tube placement is corrected for a successful endotracheal intubation. | 25 | 0 | 0 |
| Nathan | Nathan is injected with Fentanyl. Oxygen is administered via a mask. An oxygen wall port pressure loss occurs. The oxygen bottle is attached to supply oxygen. | 20 | 0 | 0 |
| Gus | A ventilator mask is placed on Gus and oxygen is administered via a mask. Succinylcholine is injected and the mask is removed. A failed endotracheal intubation occurs as an esophageal intubation. Endotracheal intubation then occurs. | 20 | 0 | 0 |
| Joel | Airway obstruction occurs at the beginning of the scenario. the obstruction is removed, and oxygen is supplied via a mask. Etomidate and succinylcholine are administered, and the mask is removed. An endotracheal tube is set. | 30 | 0 | 0 |
| Total | 123 | 2 | 0 |
Although the tidal volume is not shown for these scenarios, it should be noted that mild to moderate discrepancies between the tidal volume set on the anesthesia machine and that observed for the patient were observed in the engine. This is also a common observation in clinical practice, because the anesthesia machine may have to overcome the patient condition and airway resistance to provide sufficient tidal volume [127] .
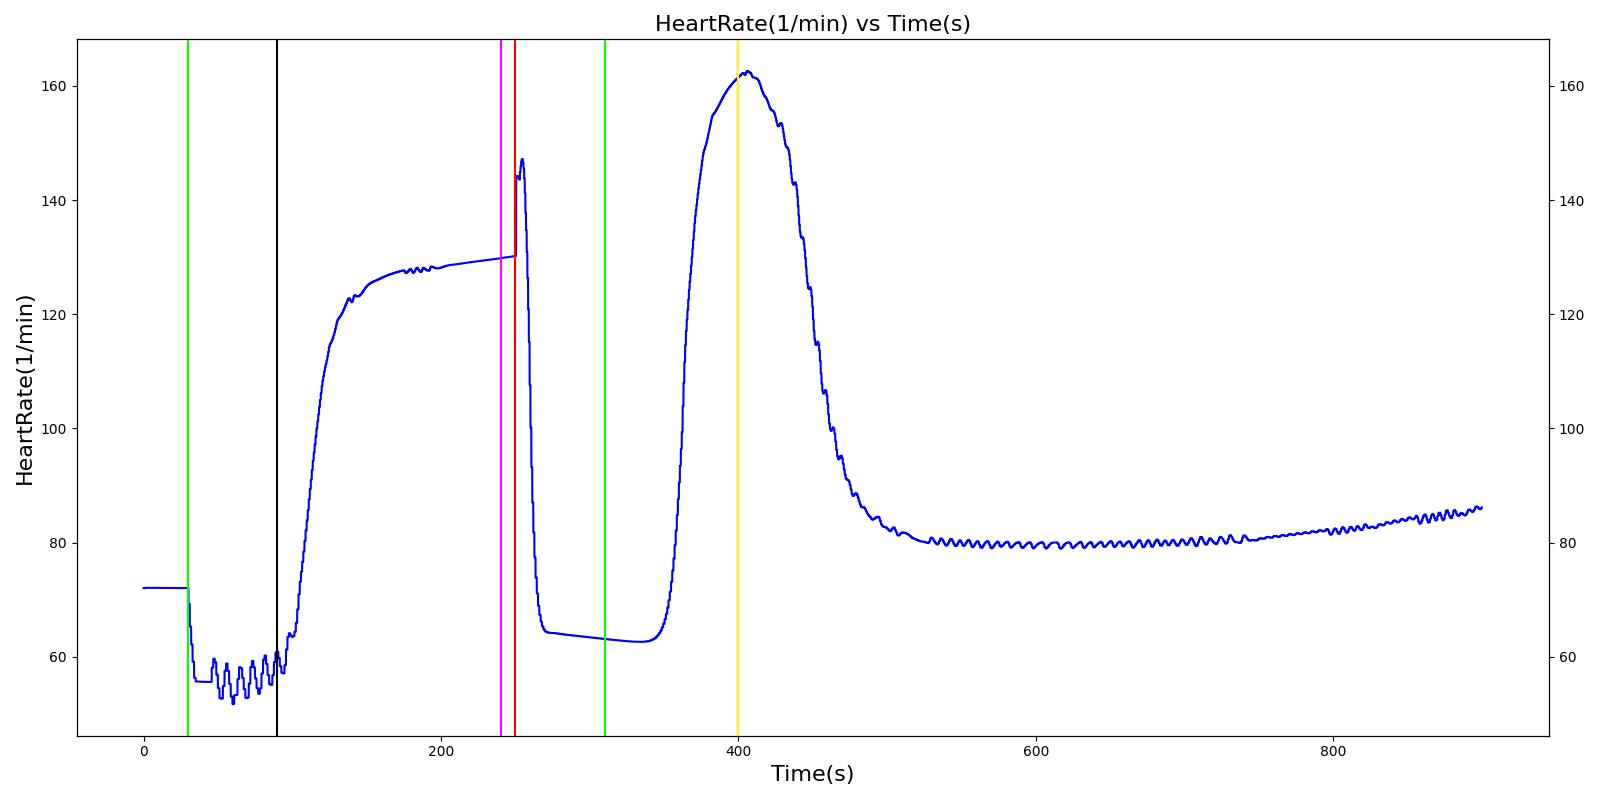
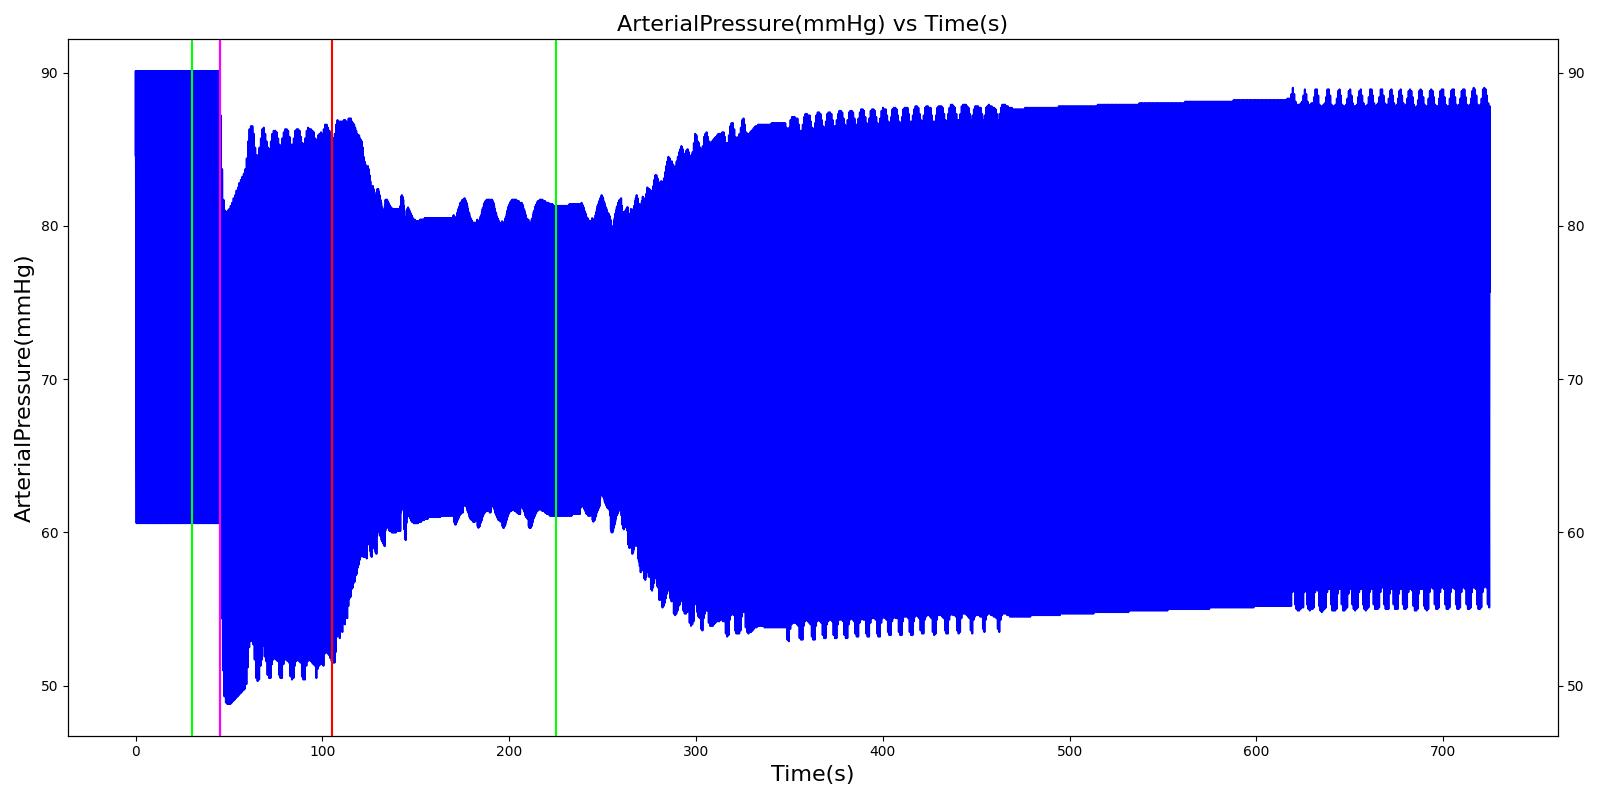
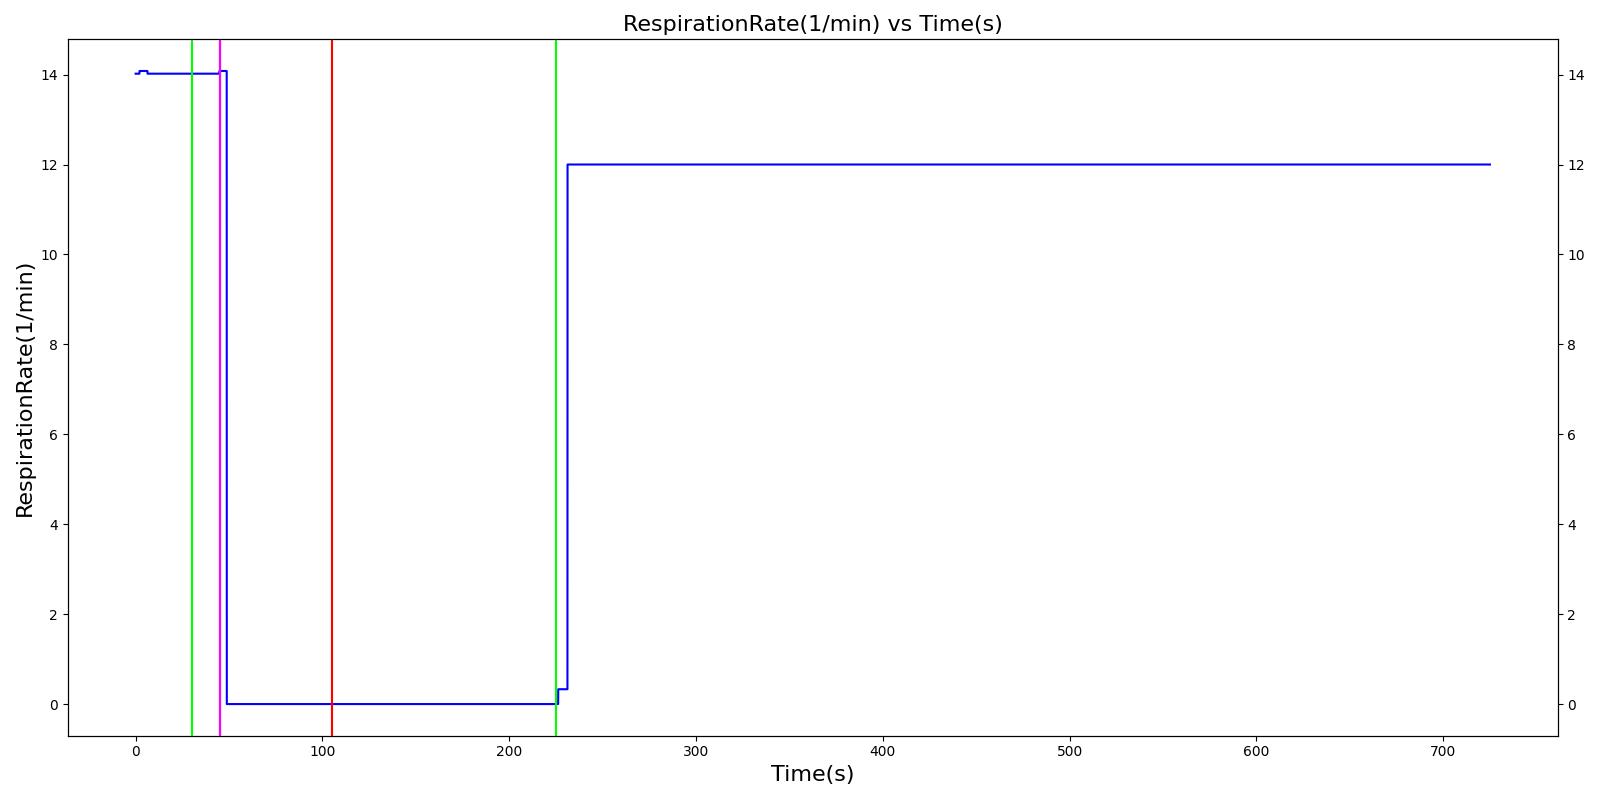
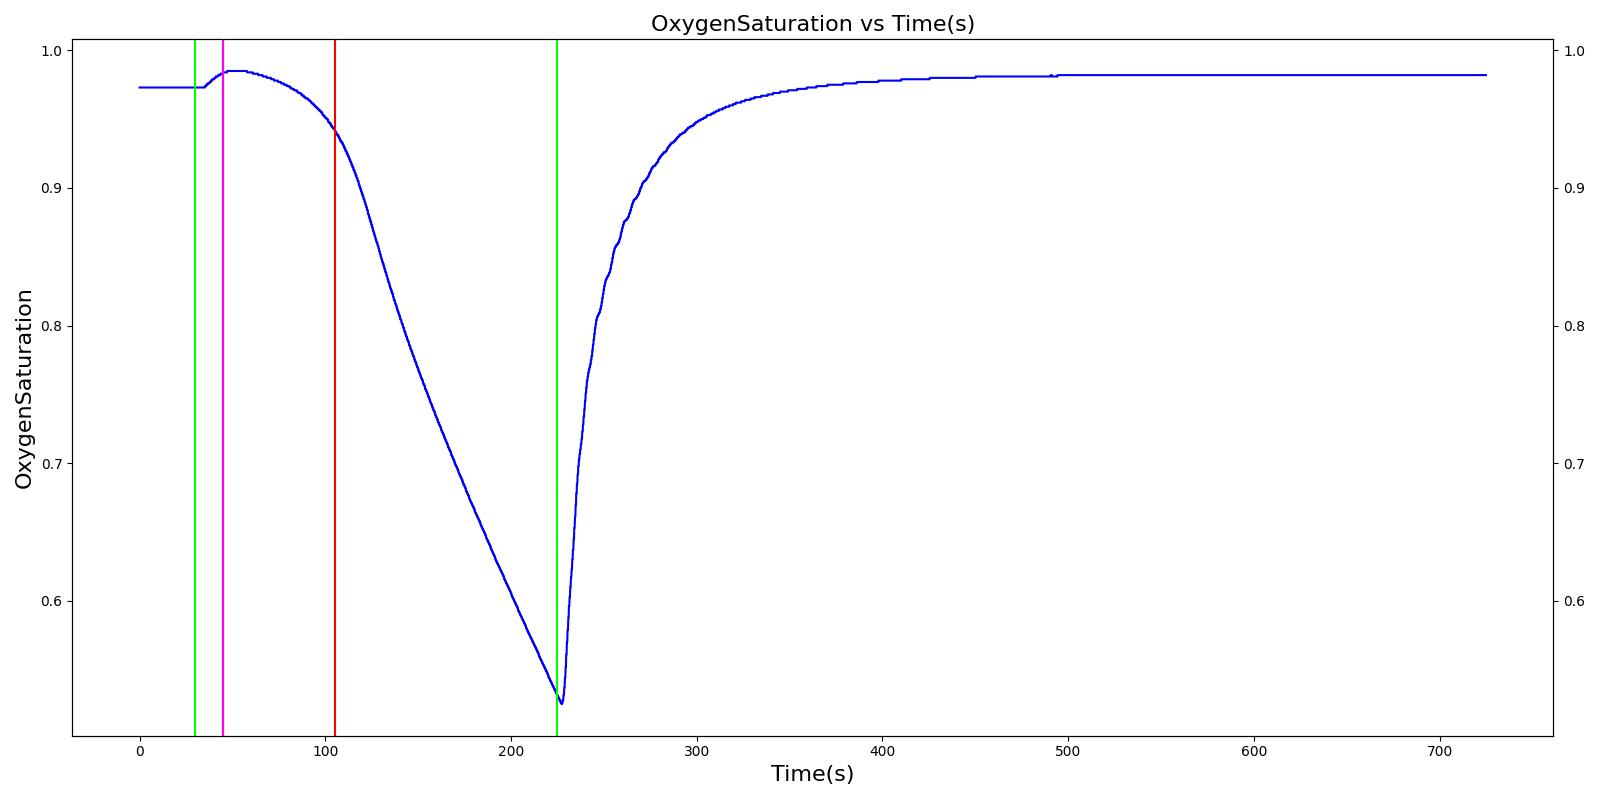
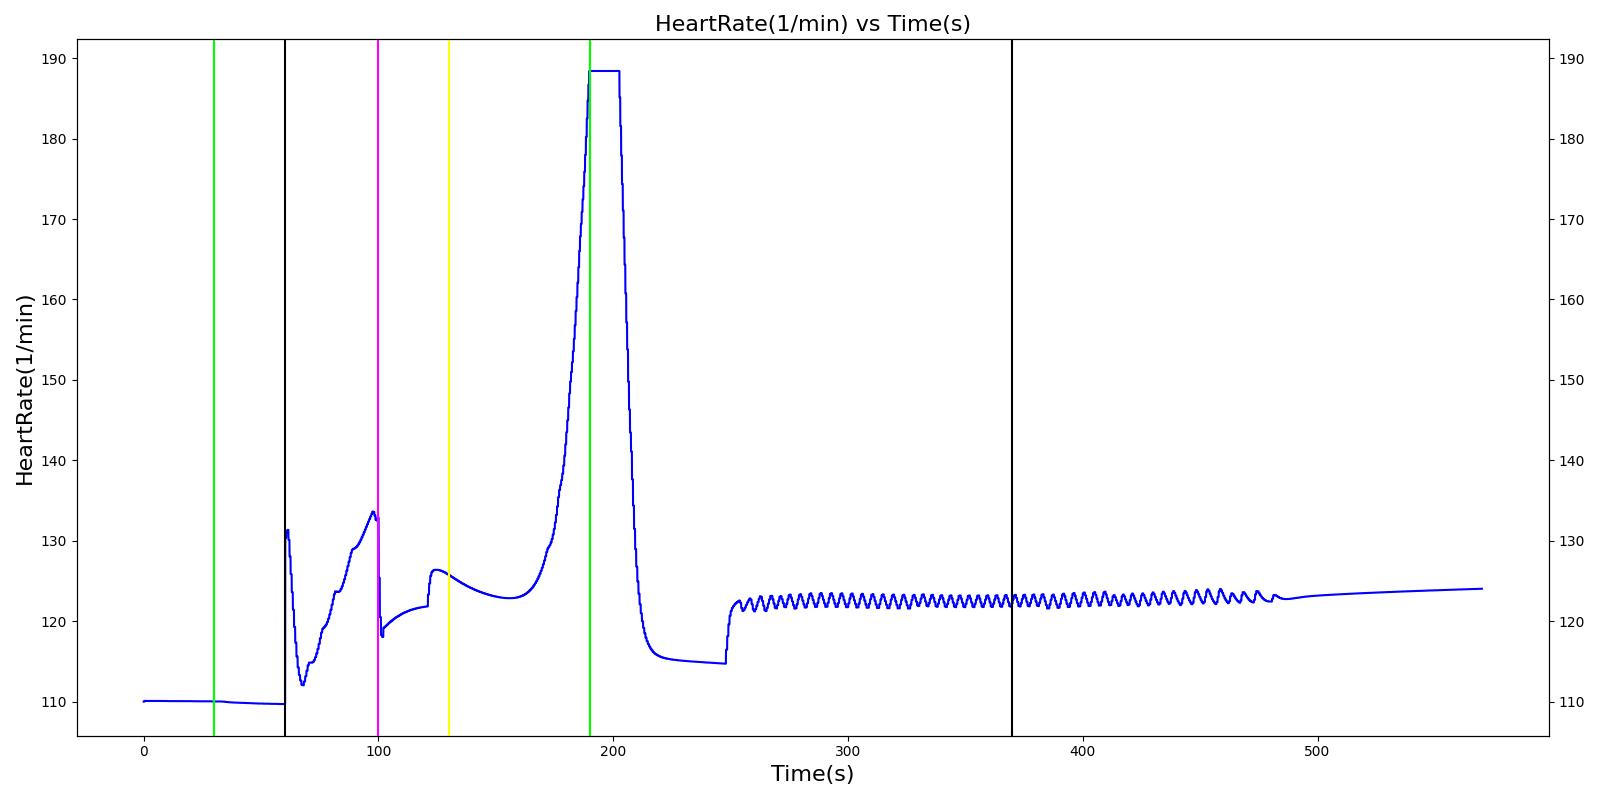
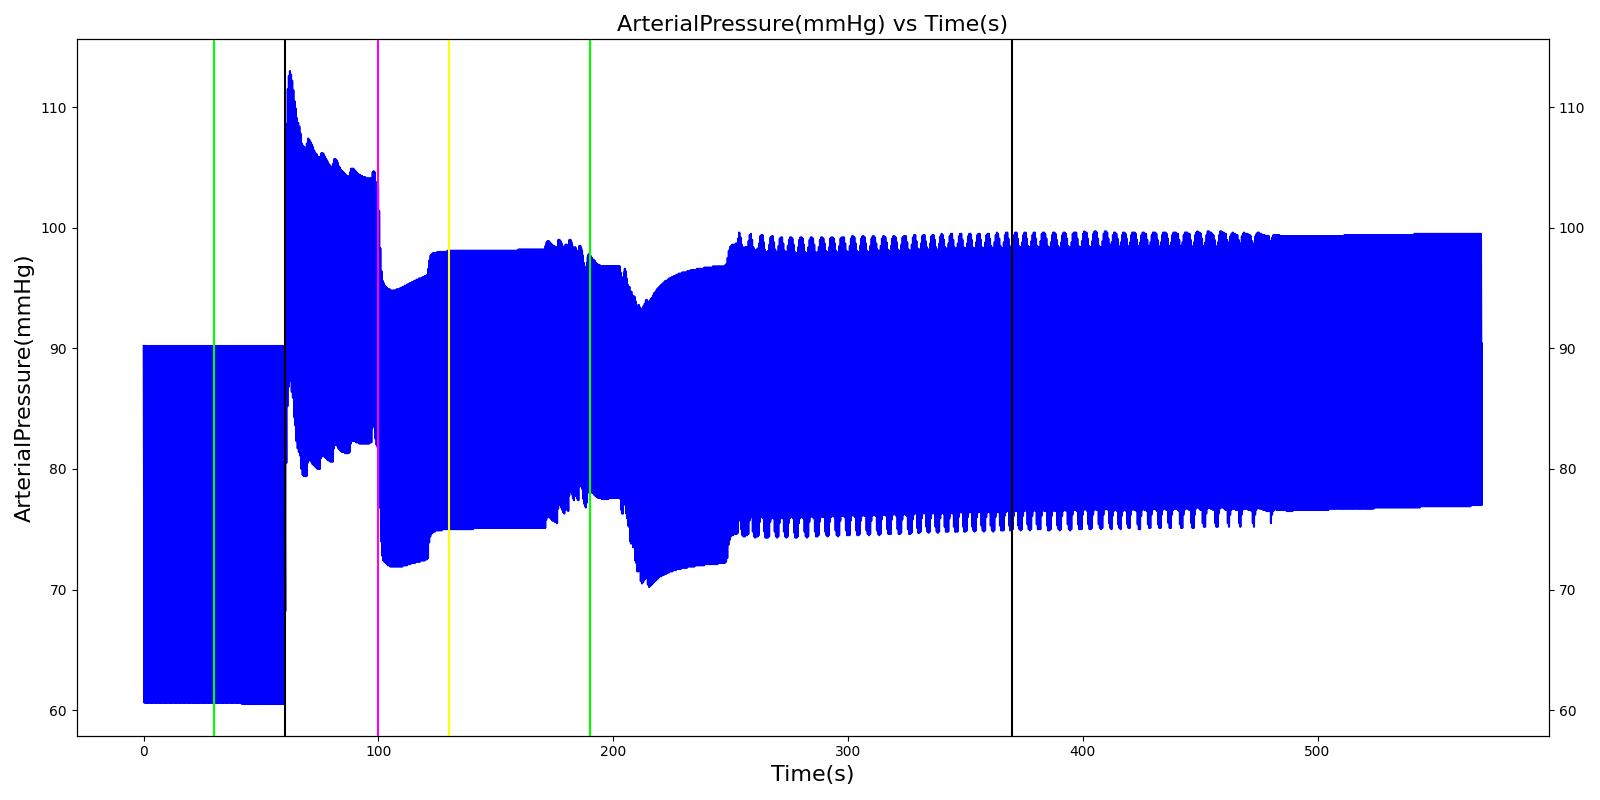
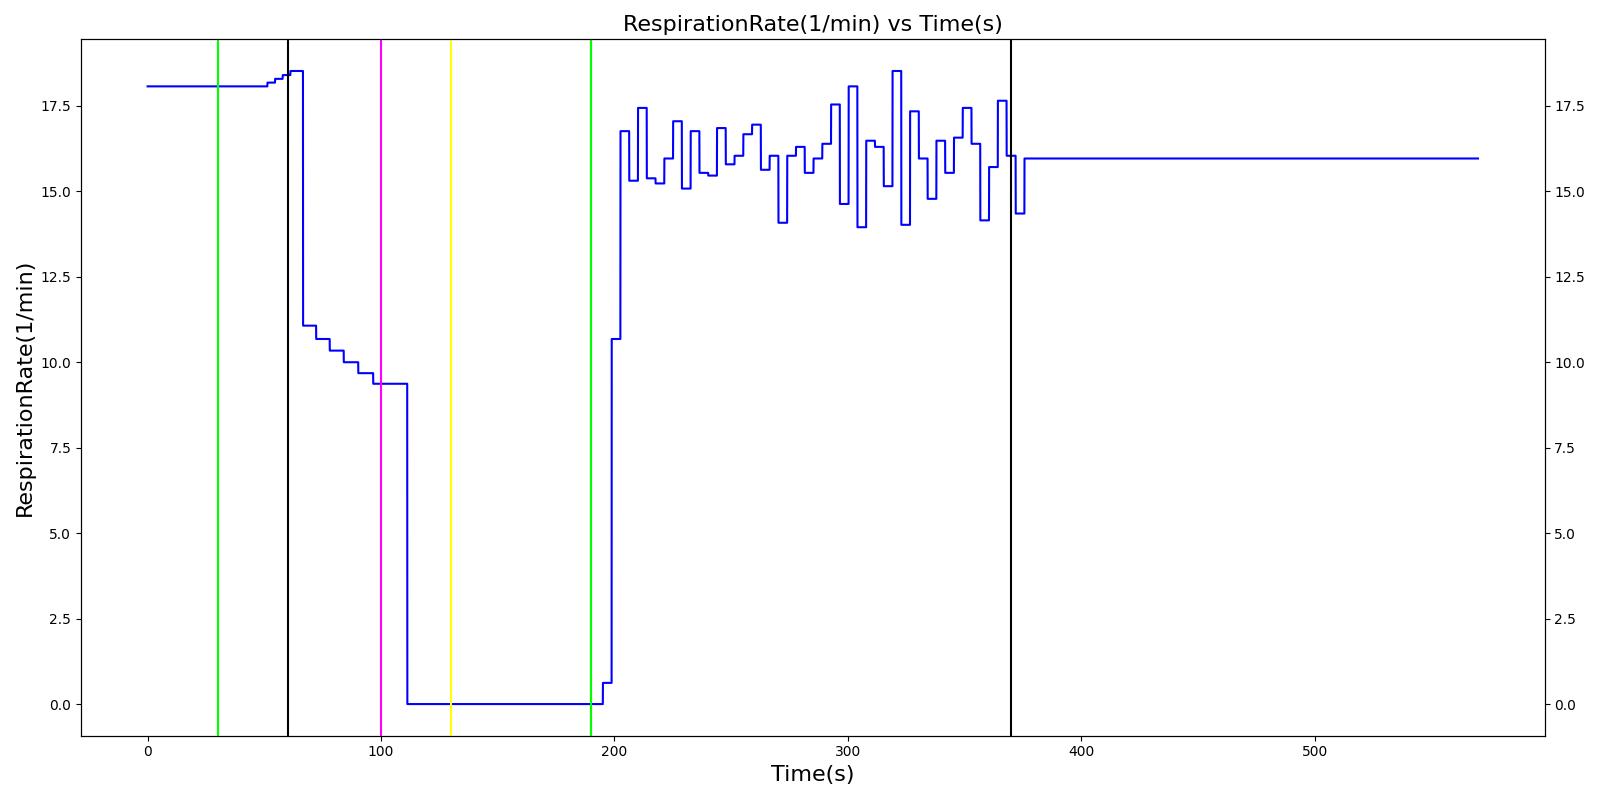
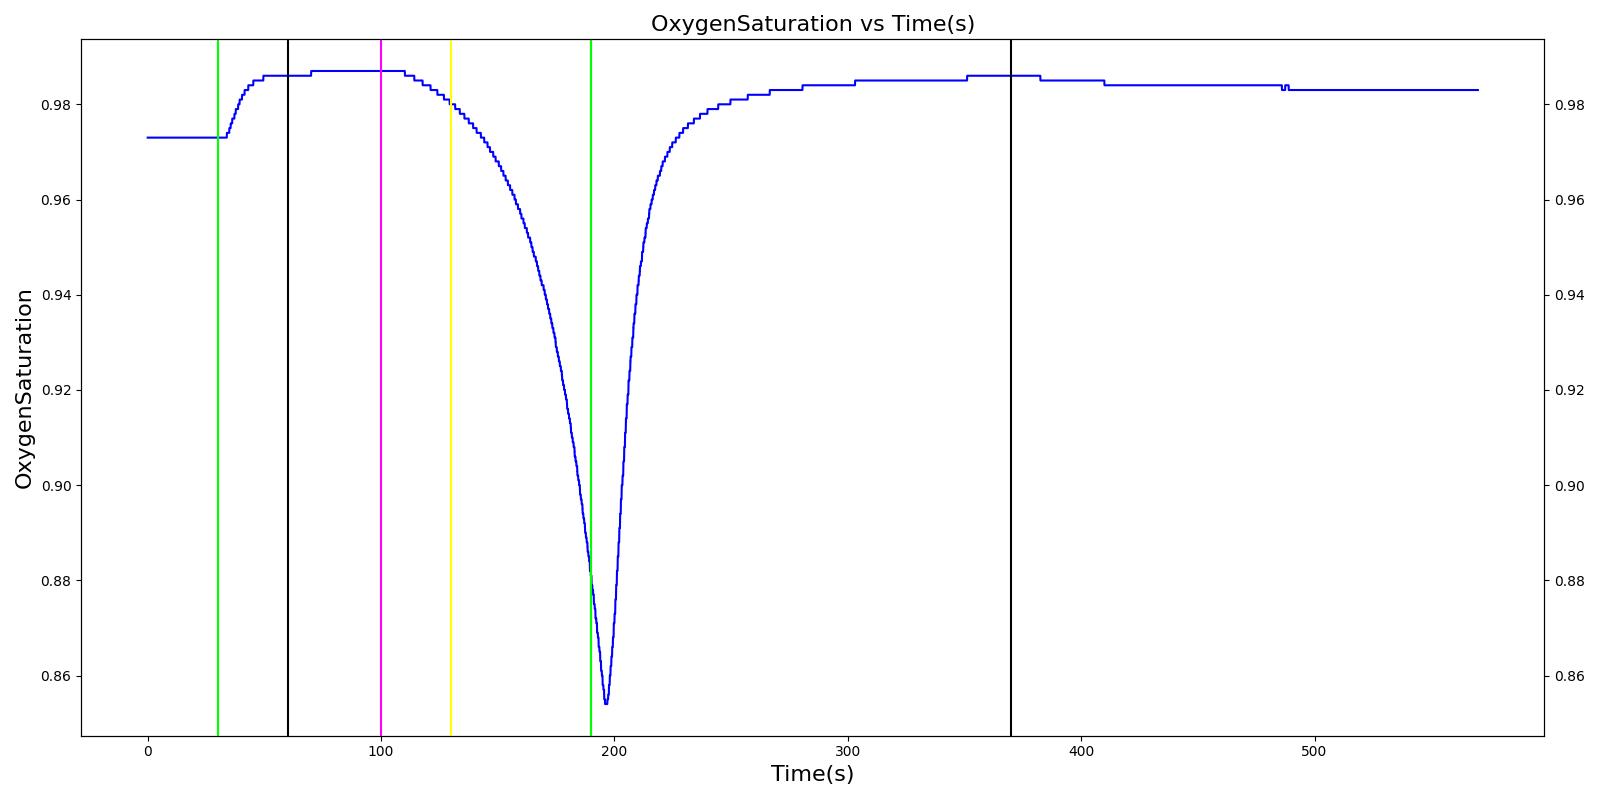
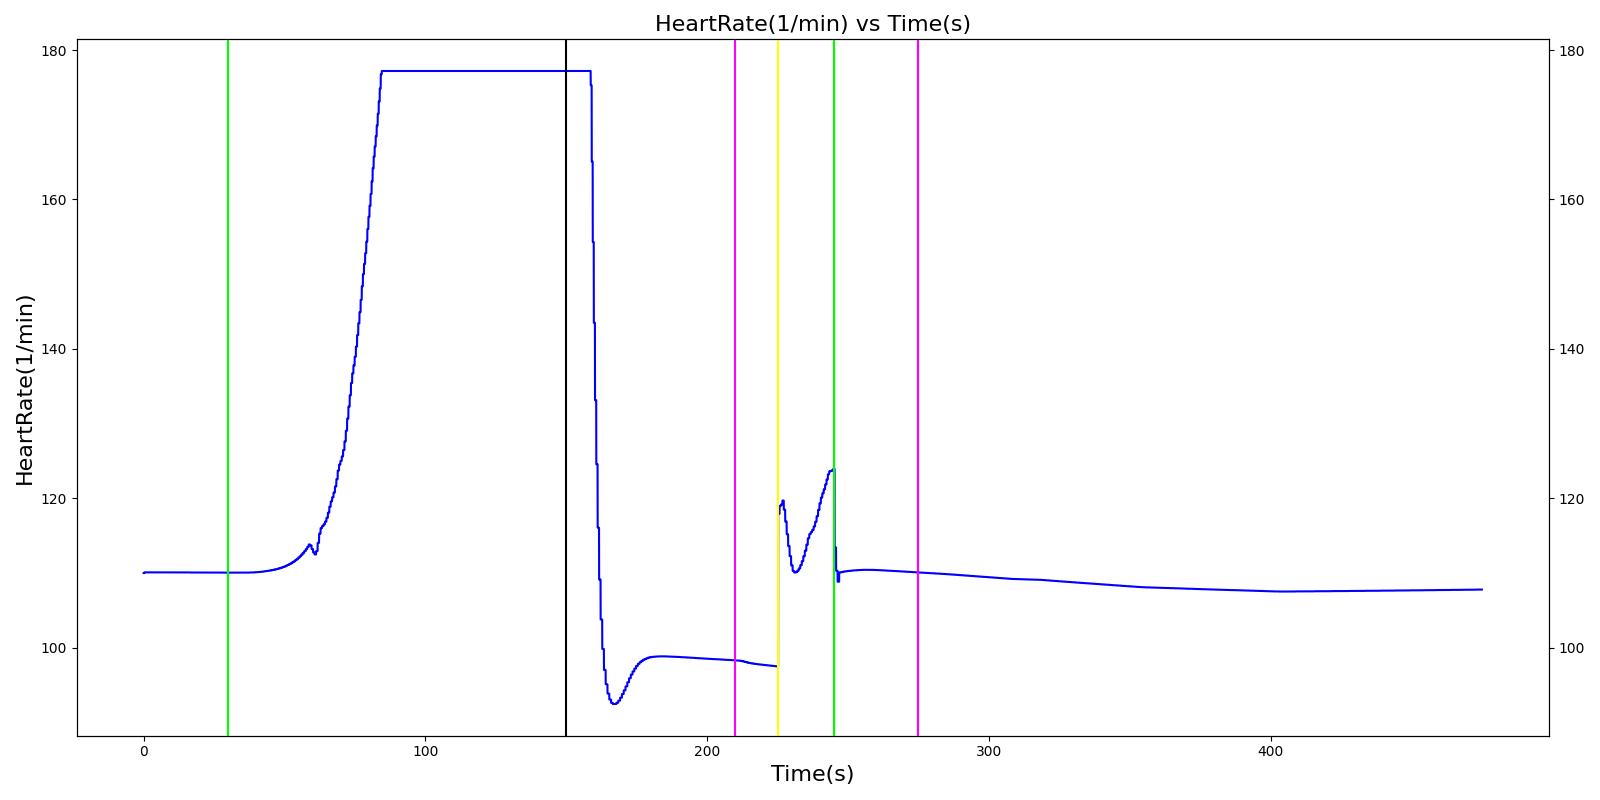
Cynthia
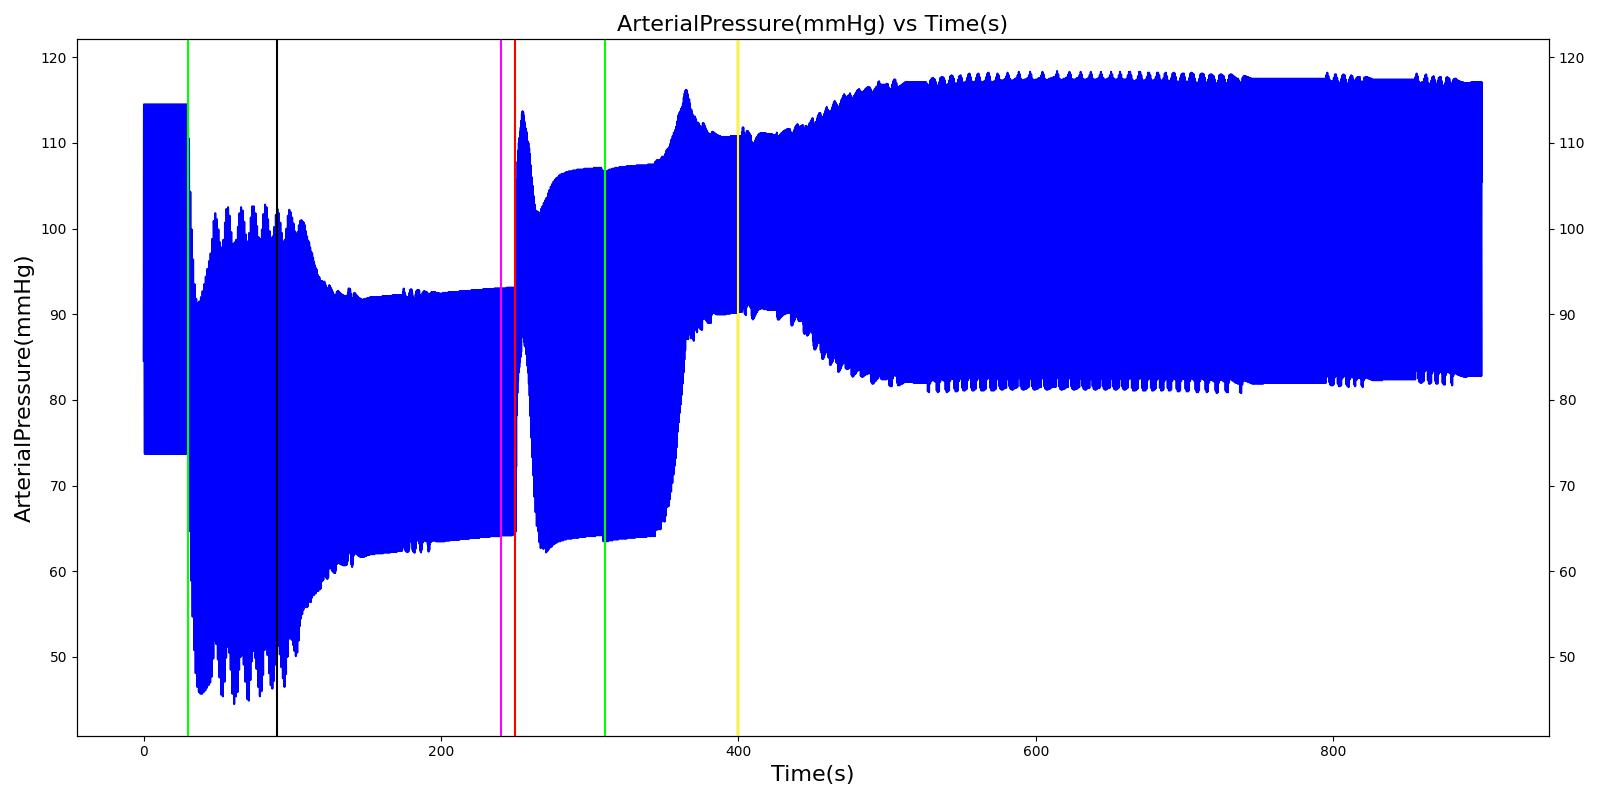
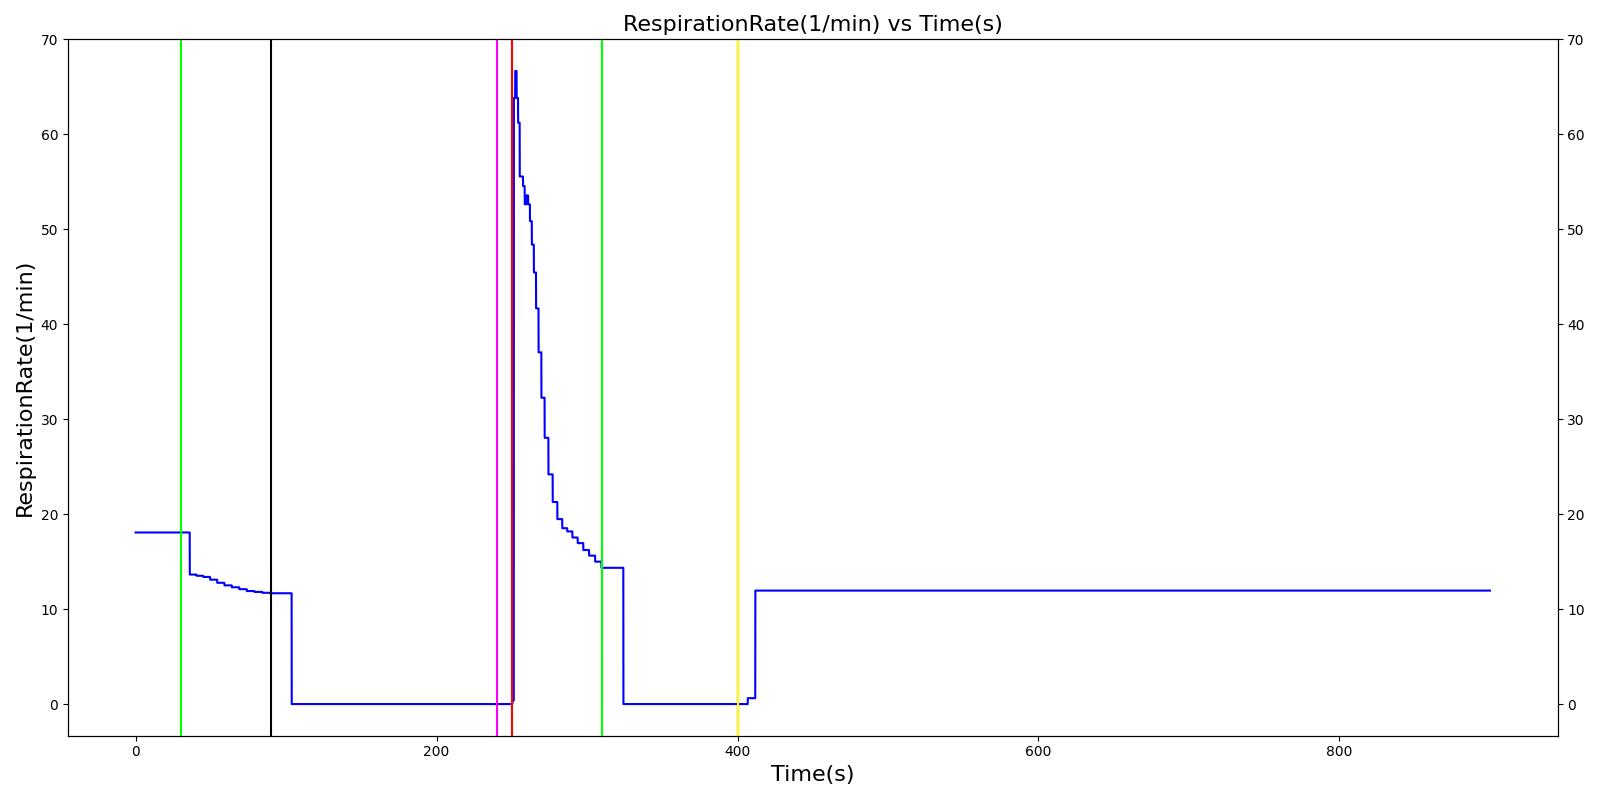
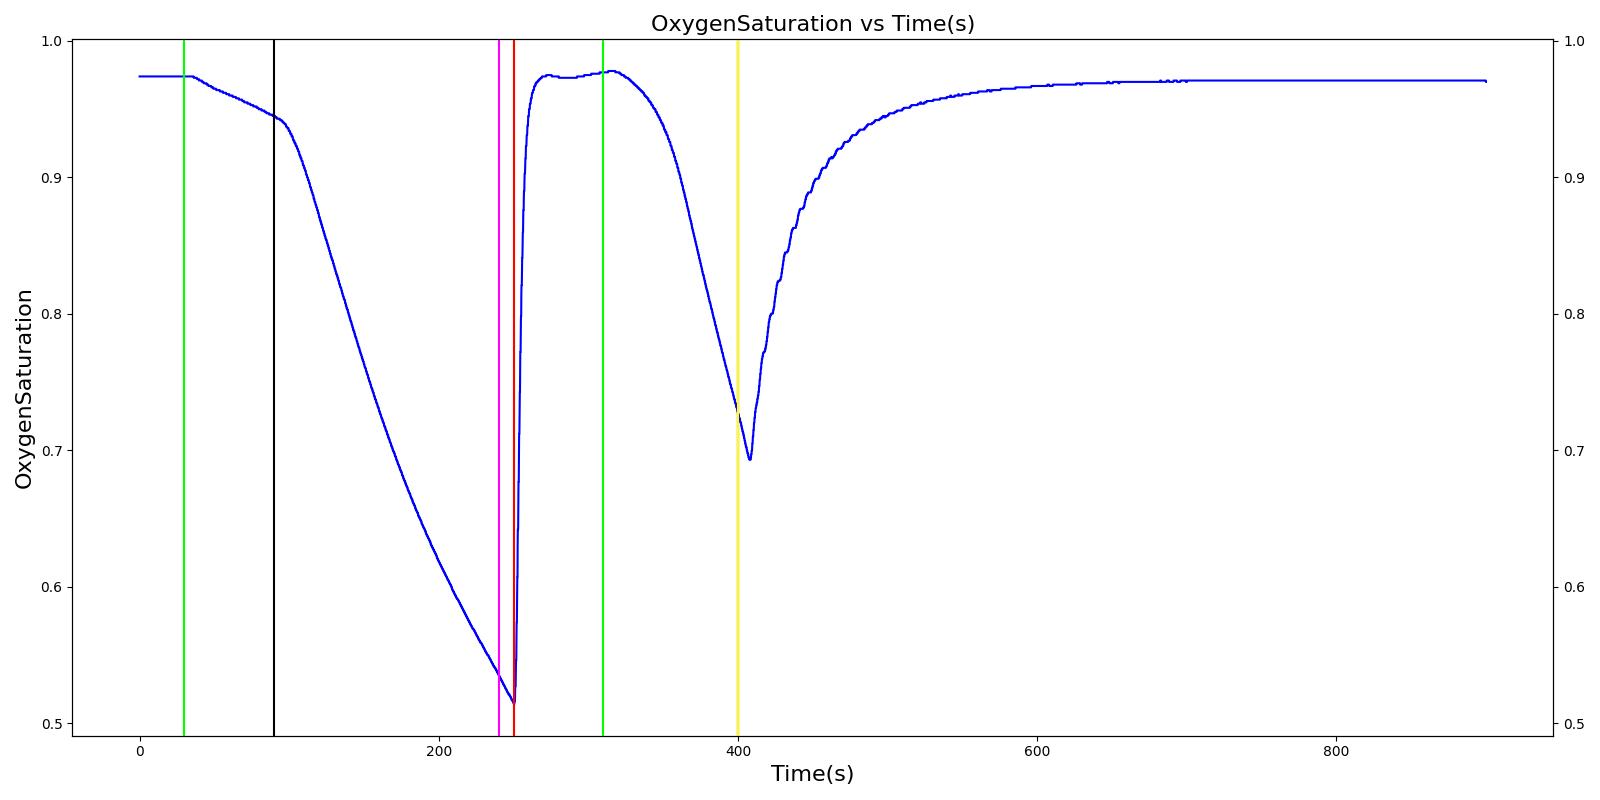
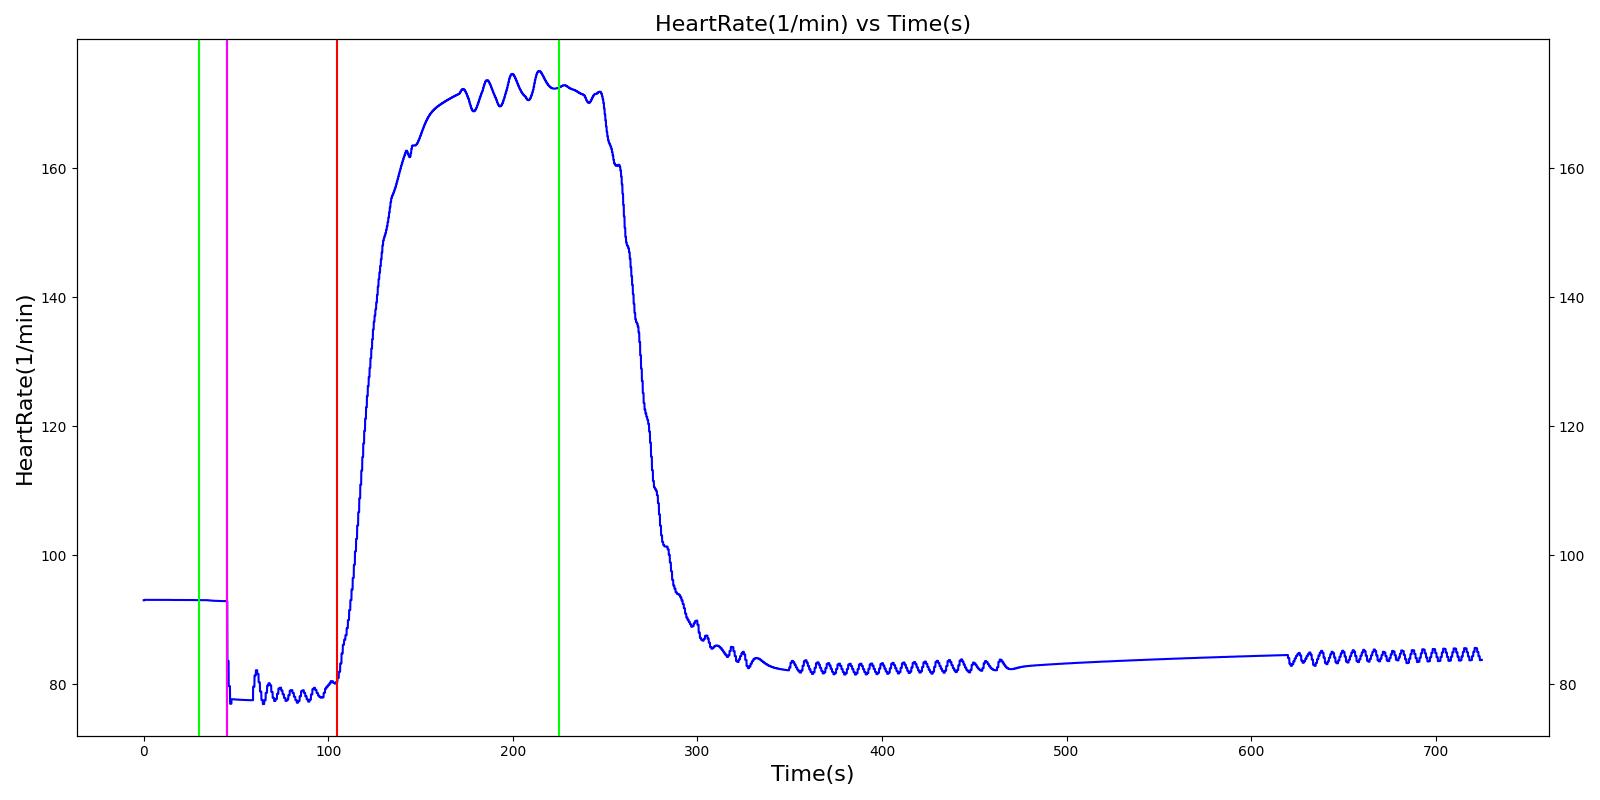
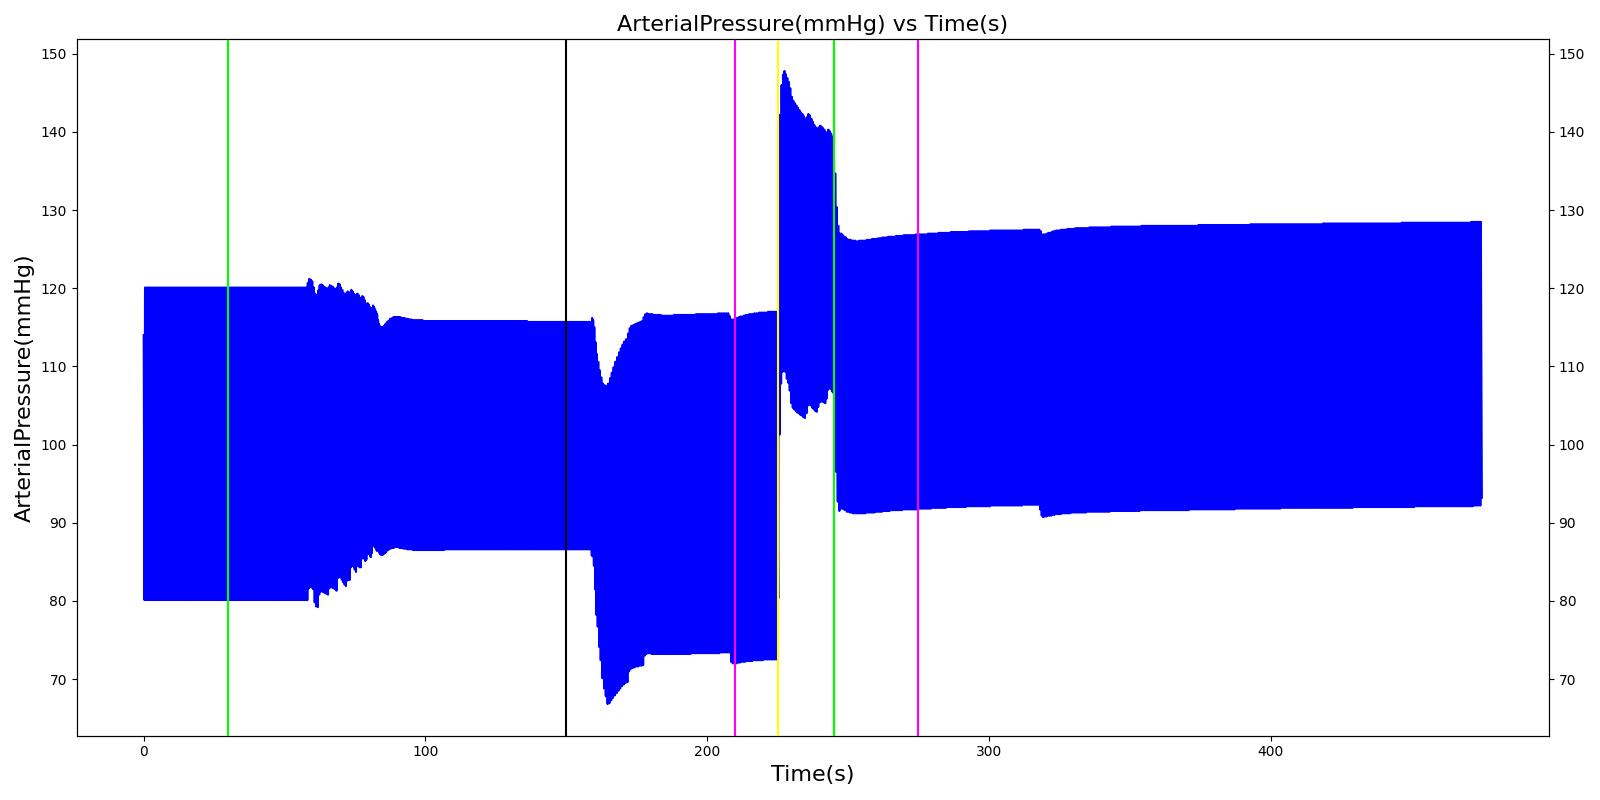
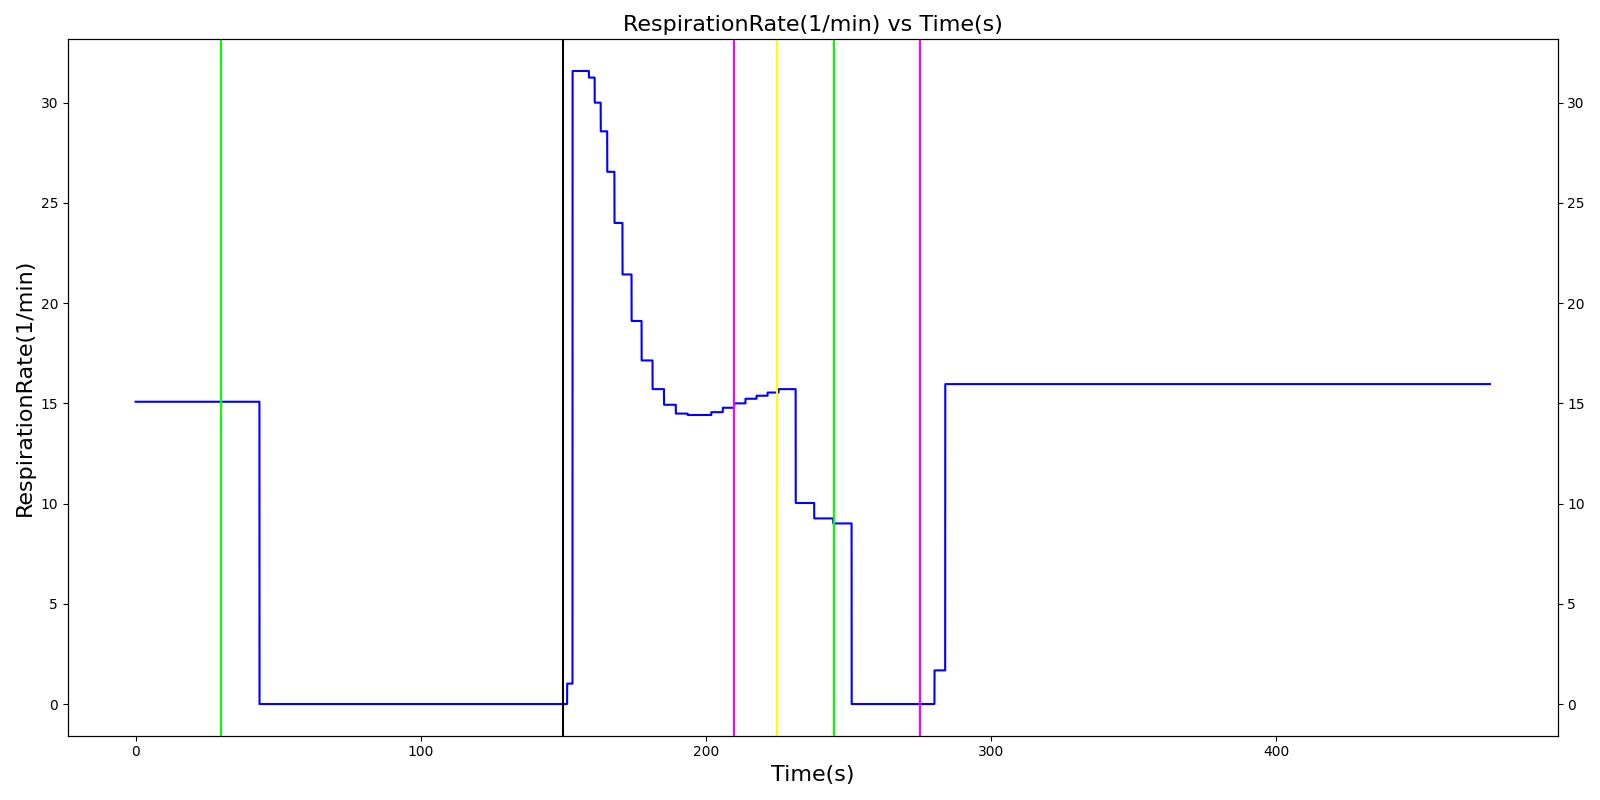
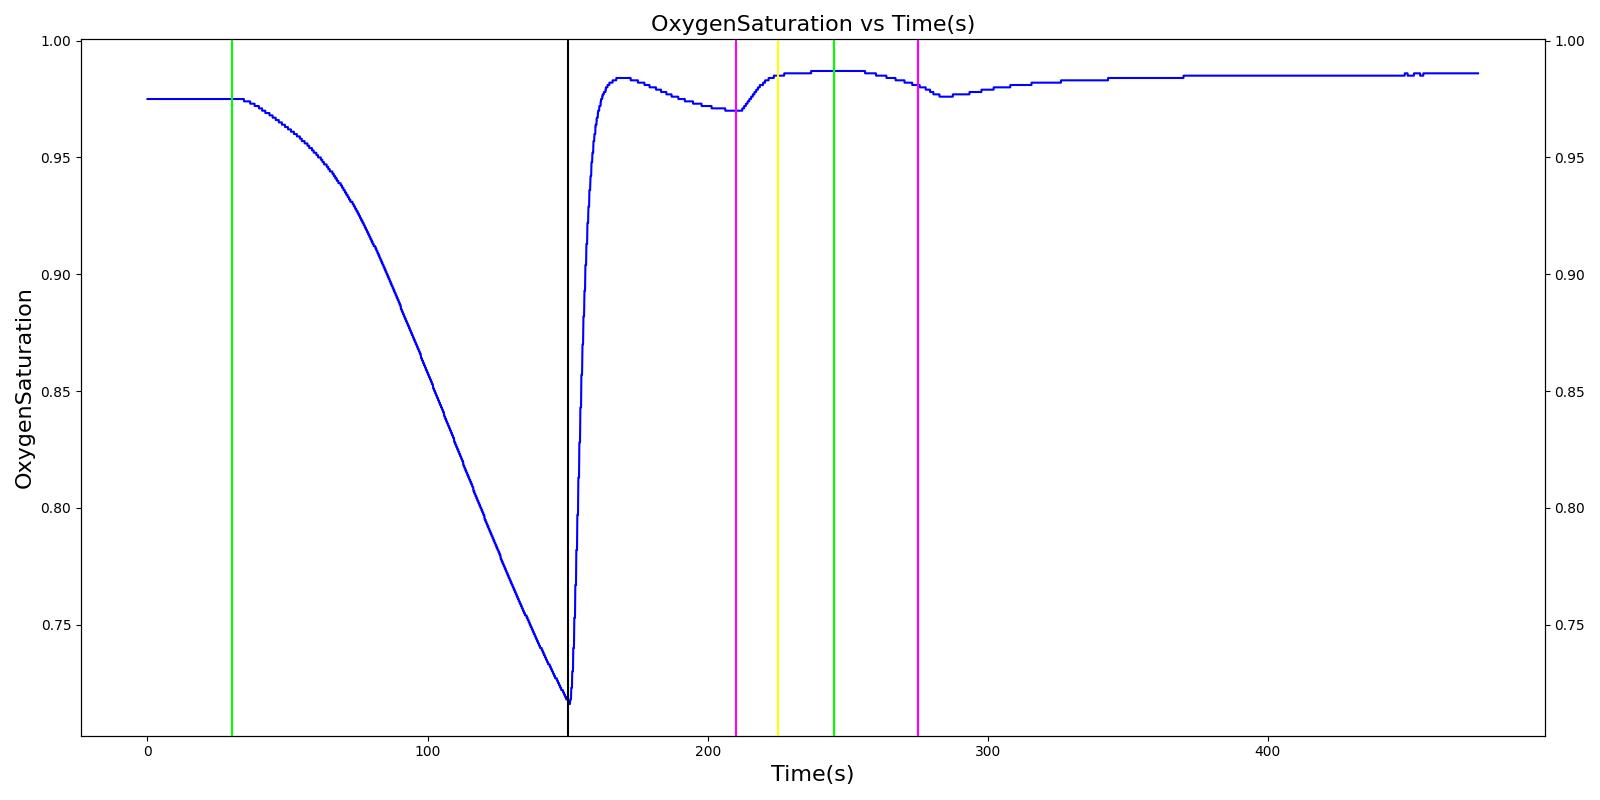
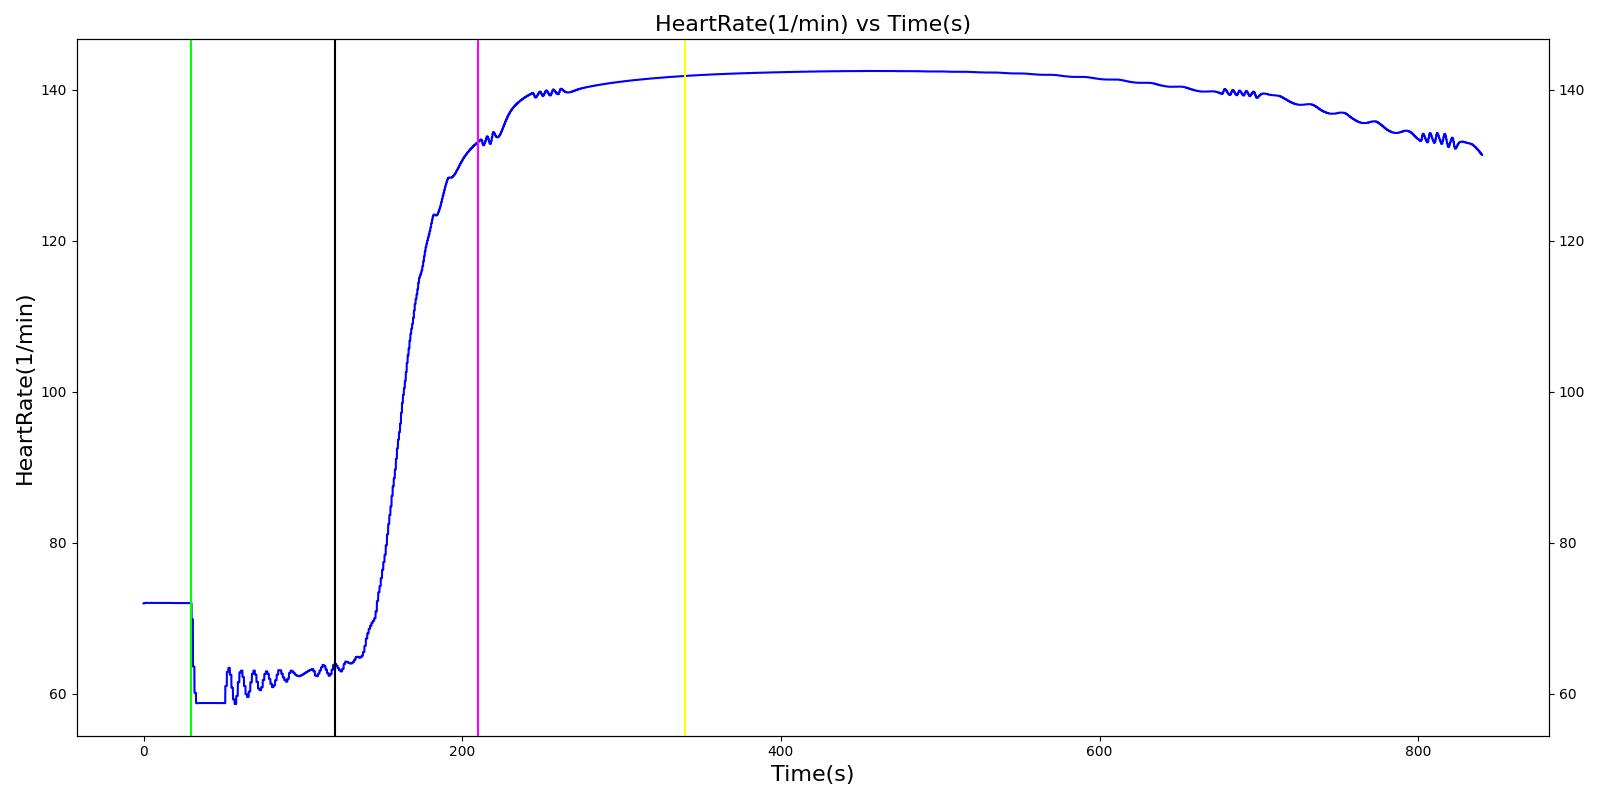
The Cynthia scenario begins with the administration of midazolam at 50 seconds with a full severity airway obstruction occurring at 110 seconds. At 260 seconds a ventilator mask is placed on Cynthia. Twenty seconds later, the airway obstruction is removed and 30 milligrams of ketamine are administered via a bolus injection. Rocuronium is administered one minute later, and Cynthia is intubated 40 seconds after that. The Cynthia scenario shows excellent agreement with the qualitative and expected SME trends. However, there is a minor inconsistency in the systolic and diastolic pressure decrease following the administration of midazolam. The SME validation predicted a 15-25% decrease in systolic/diastolic pressures following the administration; however, the observed decrease was approximately 10%. This decrease was considered acceptable since other references predicted varying degrees of pressure decrease.
 |  |
 |  |
 | |
Table 2 The Cynthia scenario displays the effects of sequential midazolam administration, airway obstruction, ventilator mask, ketamine and rocuronium administration, and intubation. This scenario shows some good agreement with the expected qualitative and SME trends.
| Segment | Notes | Action Occurrence Time (s) | Sample Scenario Time (s) | Heart Rate (beats/min) | Systolic Pressure (mmHg) | Diastolic Pressure (mmHg) | Respiration Rate (mmHg) | Oxygen Saturation (mmHg) |
|---|---|---|---|---|---|---|---|---|
| Administer Midazolam - 3 mg | Drug Onset in 1-3 min | 30 | 90 | Mild Increase [127]; 5-10% Decrease [269] | Moderate Decrease [127]; 15-25% Decrease [269] | Moderate Decrease [127]; 15-25% Decrease [269] | Moderate Decrease [127]; Marked Decrease to 0 [269] | As long as some respiration rate, little change. If RR=0, then begins to drop along O2 curve. |
| Airway Obstruction of Severity 1.0 | Represents an aspiration | 90 | 240 | If O2 decreases, Increase [269] | If O2 decreases, Increase [269] | If O2 decreases, Increase [269] | NC [269] | Drop according to preoxygenated O2 curve |
| Apply Mask and Turn on Ventilator | 240 | 250 | If above increased, Decrease [269] | If above increased, Decrease [269] | If above increased, Decrease [269] | Ventilator On; but complete block, so NC | Continues to decrease because still fully blocked | |
| Administer Ketamine - 30 mg/ End of Airway Obstruction | Drug Onset < 2 minutes | 250 | 310 | Moderate Increase [127]; 15-25% Increase [269] | Moderate Increase [127]; 15-25% Increase [269] | Moderate Increase [127]; 15-25% Increase [269] | Ventilator On; therefore, 14 | Begins to increase because airway obstruction is cleared |
| Administer Rocuronium - 62mg | Drug Onset in 60-90 seconds | 310 | 400 | NC [282]; NC [269] | NC [282]; NC [269] | NC [282]; NC [269] | Ventilator On; therefore, 14 | Continues to increase |
| Successful Intubation | 400 | 900 | NC [269] | NC [269] | NC [269] | NC | NC |
Gus
A ventilator mask is applied to Gus at 50 seconds, and succinylcholine is injected one minute later. After an additional minute, an unsuccessful intubation occurs, leading to the endotracheal tube residing within the esophagus. After two minutes the tube is removed and correctly set in the trachea. The produced results show excellent agreement with the expected validation trends.
 |  |
 |  |
 | |
Table 3 The Gus scenario displays the effects of sequential ventilator mask application, succinylcholine injection, esophageal intubation and then a successful endotracheal intubation. This scenario shows good agreement with the SME and qualitative validation.
| Segment | Notes | Action Occurrence Time (s) | Sample Scenario Time (s) | Heart Rate (beats/min) | Systolic Pressure (mmHg) | Diastolic Pressure (mmHg) | Respiration Rate (mmHg) | Oxygen Saturation (mmHg) |
|---|---|---|---|---|---|---|---|---|
| Mask Ventilate with Oxygen | 30 | 45 | NC [269] | NC [269] | NC [269] | Slight decrease to due anesthesia machine resistance ; NC [269] | 100 | |
| Administer Succinylcholine - 100mg | Drug Onset < 1 minute | 45 | 105 | Mild Increase [127]; 5-10% Decrease [269] | Mild Increase [127]; 5-10% Decrease [269] | Mild Increase [127]; 5-10% Decrease [269] | Goes to Zero [127]; Goes to Zero [269] | NC [269] |
| Esophageal Intubation | 105 | 225 | If O2 decreases, Increase [269] | If O2 decreases, Increase [269] | If O2 decreases, Increase [269] | Ventilator rate is 16 | May slowly decrease along O2 curve [269] | |
| Successful Intubation | 225 | 725 | If above increased, Decrease [269] | If above increased, Decrease [269] | If above increased, Decrease [269] | 16 | Begins to increase to a normal level [269] |
Hassan
At the beginning of the scenario, a ventilator mask is applied to Hassan. He then receives bolus injections of ketamine and succinylcholine. This leads to an increase in the heart rate and arterial pressures due to the ketamine injection. The respiration rate begins to decrease as the patient begins to lose consciousness. After the succinylcholine injection, there is a decrease in the heart rate and arterial pressures. In addition, the respiration rate falls to zero due to the neuromuscular block. At 180 seconds, an endotracheal tube is set into the right bronchi, leading to only one lung being ventilated. This leads to a minor reduction in the oxygen saturation. Due to the reduced oxygen intake, the heart rate and arterial pressures begin to increase to compensate. The tube is reset into the trachea and the vital signs begin to return to normal. All of these trends follow the expected validation trends.
 |  |
 |  |
 | |
Table 4 Hassan displays the effects of a right mainstem intubation after the patient has been injected with ketamine and succinylcholine. The engine output shows complete agreement with the validation trends.
| Segment | Notes | Action Occurrence Time (s) | Sample Scenario Time (s) | Heart Rate (beats/min) | Systolic Pressure (mmHg) | Diastolic Pressure (mmHg) | Respiration Rate (mmHg) | Oxygen Saturation (mmHg) |
|---|---|---|---|---|---|---|---|---|
| Mask Ventilate with Oxygen | 30 | 60 | NC [269] | NC [269] | NC [269] | Slight decrease to due anesthesia machine resistance ; NC [269] | 100 [269] | |
| Administer Ketamine - 168 mg | Drug Onset < 1 minute | 60 | 100 | Moderate Increase [127]; 15-25% Increase [269] | Moderate Increase [127]; 15-25% Increase [269] | Moderate Increase [127]; 15-25% Increase [269] | Mild Decrease [127]; 25-50% Decrease [269] | NC [269] |
| Administer Succinylcholine - 115mg | Drug Onset < 1 minute | 100 | 130 | Mild Increase [127]; 5-10% Decrease [269] | Mild Increase [127]; 5-10% Decrease [269] | Mild Increase [127]; 5-10% Decrease [269] | Ventilator is on; therefore, 16 | Begins to drop according to preoxygenated O2 curve [269] |
| Right Mainstem Intubation | Intent is to simulate tube migration | 130 | 220 | NC, If undetected and O2 level drops significantly, Mild Increase [269] | NC, If undetected and O2 level drops significantly, Mild Increase [269] | NC, If undetected and O2 level drops significantly, Mild Increase [269] | 16 | May slowly decrease along O2 curve [269] |
| Correct tube placement | Reset the intubation tube | 220 | 400 | NC, If above result in a Mild Increase, will return to normal [269] | NC, If above result in a Mild Increase, will return to normal [269] | NC, If above result in a Mild Increase, will return to normal [269] | 16 | Begins to increase to a normal level >97% [269] |
Joel
The Joel scenario begins with a full severity airway obstruction at 50 seconds. This leads to decreasing oxygen saturation and increasing heart rate and arterial pressures due to the sympathetic (endocrine) response. At 170 seconds, the obstruction is removed and the vital signs begin to return to normal. A ventilator mask is applied to Joel at 230 seconds, and he receives a 27 mg bolus injection of etomidate at 290 seconds. This leads to decreasing arterial pressure. At 310 seconds, a bolus injection of succinylcholine occurs before an endoctracheal tube is set 30 seconds later. The administration of succinylcholine leads to immediate decreases in heart rate, arterial pressures, and oxygen saturation. After the intubation occurs, the oxygen saturation begins to return to normal due to adequate ventilation. All of these results show strong agreement with the subject matter expert's expected trends.
 |  |
 |  |
 | |
Table 5 The Joel scenario displays the effects of sequential airway obstruction, ventilator mask application, etomidate administration, succinylcholine administration, and intubation. The engine results show excellent agreement with the validation trends.
| Segment | Notes | Action Occurrence Time (s) | Sample Scenario Time (s) | Heart Rate (beats/min) | Systolic Pressure (mmHg) | Diastolic Pressure (mmHg) | Respiration Rate (mmHg) | Oxygen Saturation (mmHg) |
|---|---|---|---|---|---|---|---|---|
| Airway Obstruction of Severity 1.0 | Represents an aspiration | 30 | 150 | NC until O2 drops then increase [269] | NC until O2 drops then increase [269] | NC until O2 drops then increase [269] | Goes to Zero [269] | Begins to drop according to O2 curve [269] |
| End Airway Obstruction | Represents suctioning | 150 | 210 | If above increased, Decrease [269] | If above increased, Decrease [269] | If above increased, Decrease [269] | Return to resting physiology [269] | Begins to increase to a normal level >97% [269] |
| Ventilate w/ Mask | 210 | 225 | NC [269] | NC [269] | NC [269] | NC [269] | NC [269] | |
| Administer Ketamine - 27 mg | Drug Onset < 1 minute | 225 | 245 | NC [127]; NC [269] | Mild Decrease [127]; 5-10% Decrease [269] | Mild Decrease [127]; 5-10% Decrease [269] | Mask Ventilation, so NC | NC [269] |
| Administer Succinylcholine - 115 mg | Drug Onset < 1 minute | 245 | 275 | Mild Increase [127]; 5-10% Decrease [269] | Mild Increase [127]; 5-10% Decrease [269] | Mild Increase [127]; 5-10% Decrease [269] | Mask Ventilation, so NC | Begins to drop according to preoxygenated O2 curve [269] |
| Intubate | 275 | 475 | NC [269] | NC [269] | NC [269] | NC [269] | Begins to increase to a normal level >97% [282] |
Nathan
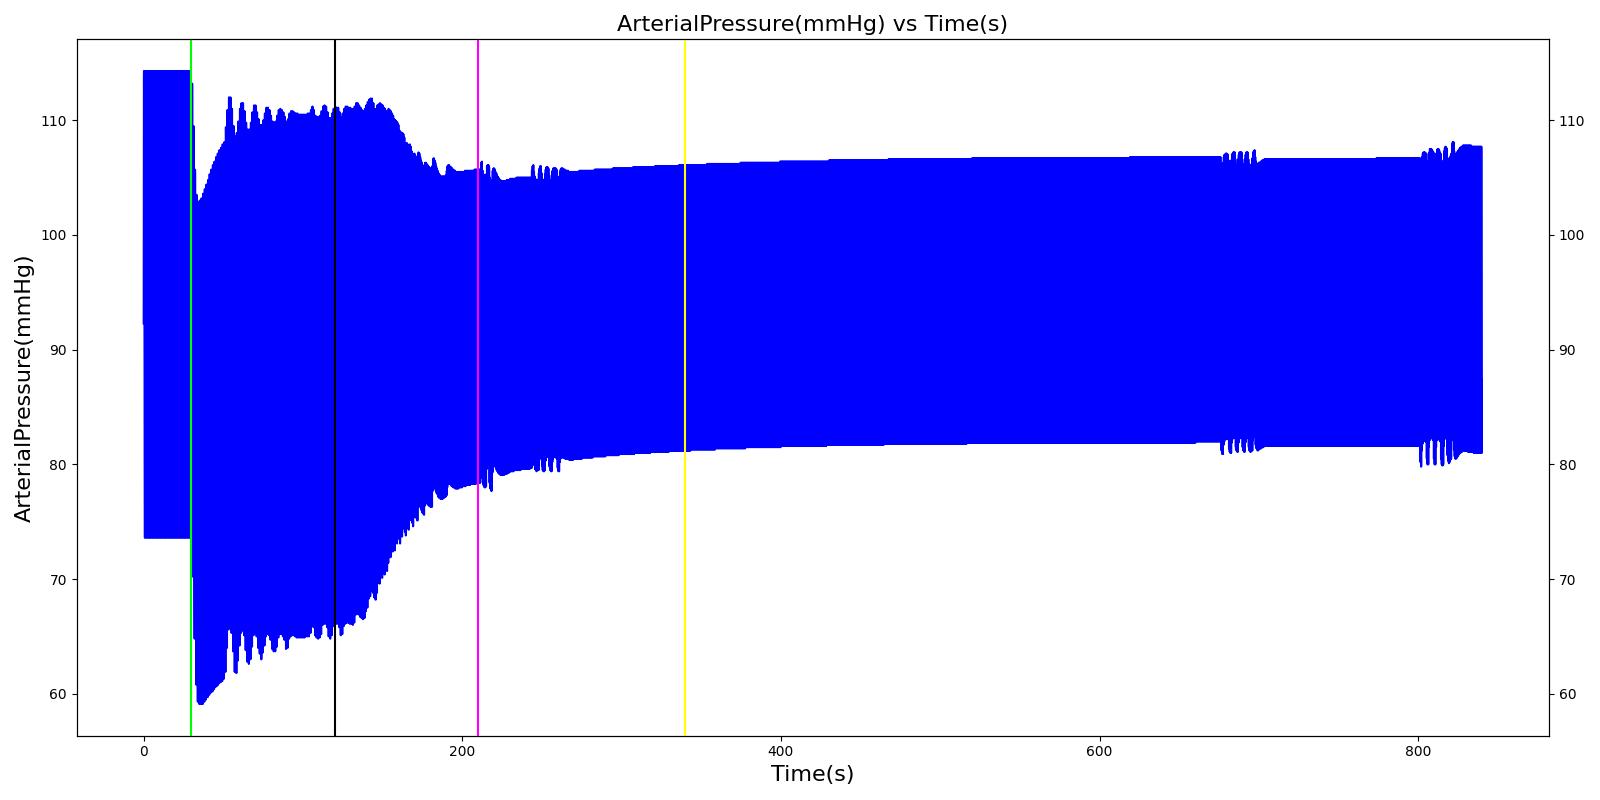
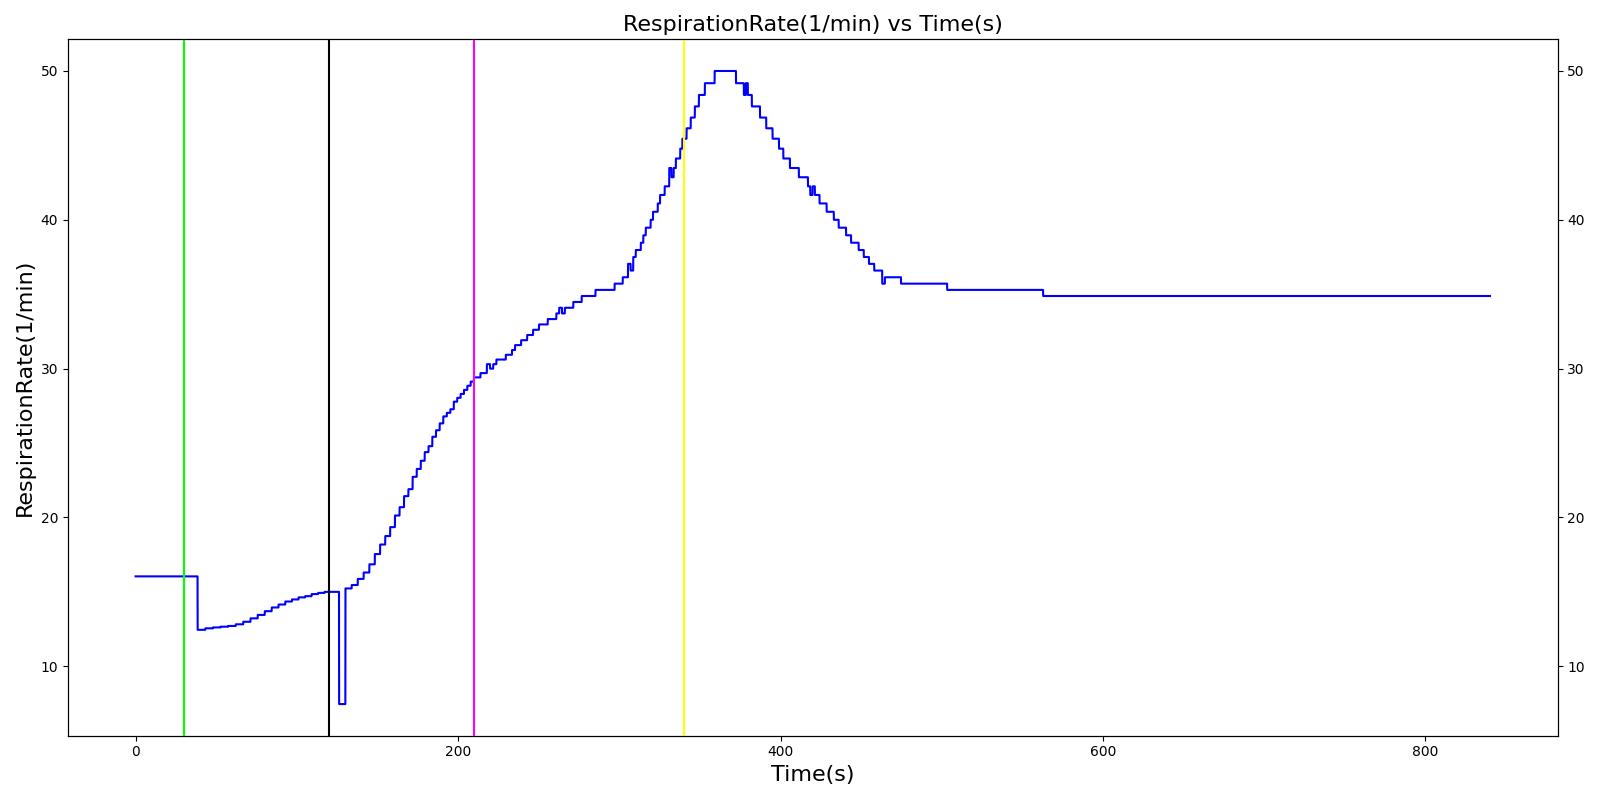
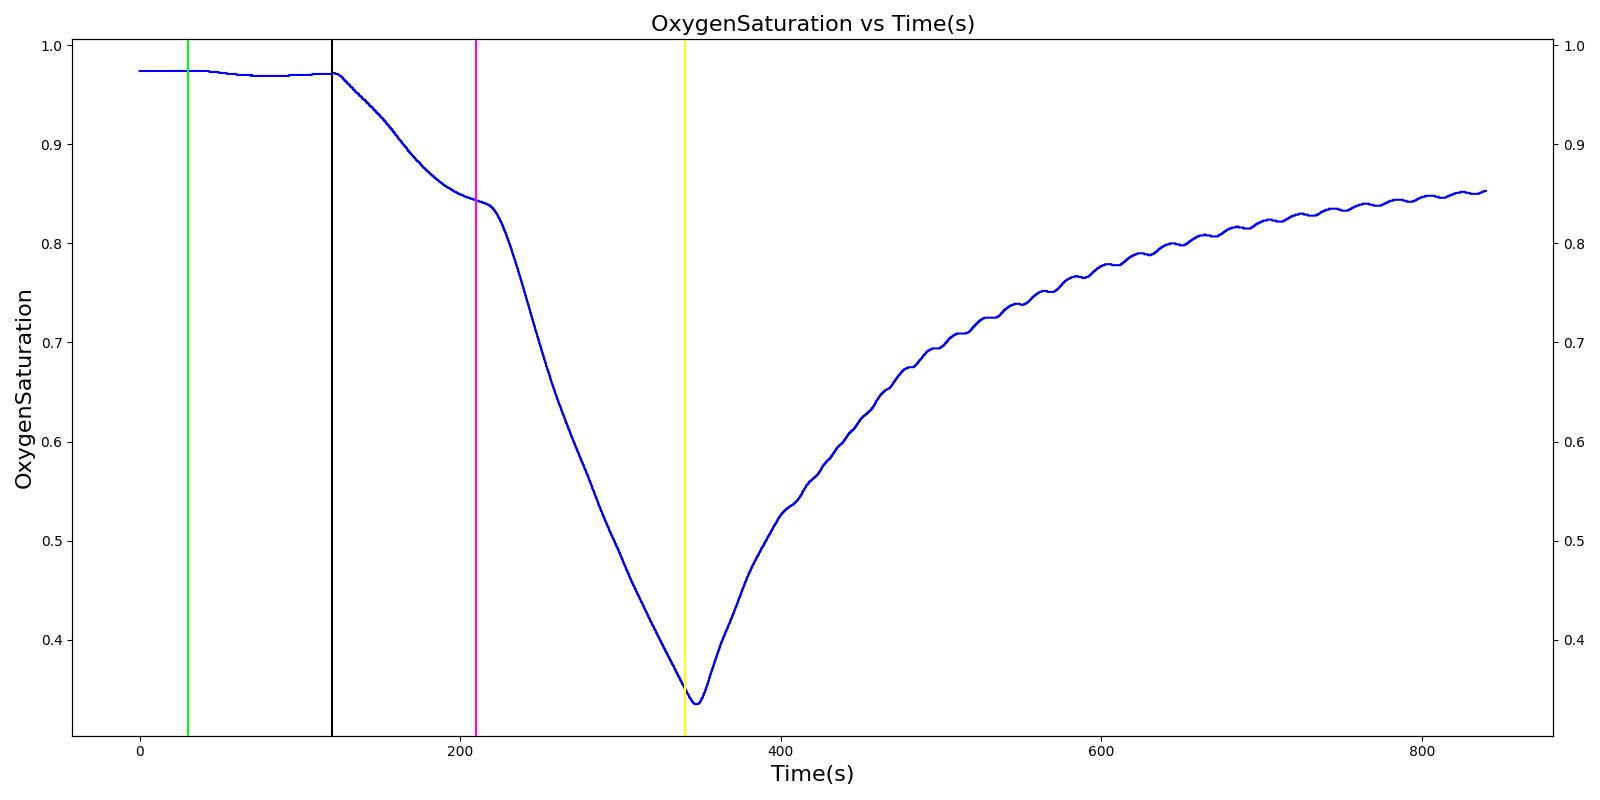
Nathan receives a bolus injection of fentanyl at a dose of 150 micrograms at a scenario time of 50 seconds, and a ventilator mask is placed at 140 seconds. Due to the administration of fentanyl, there is an observed decrease in the heart rate, arterial pressures and respiration rate. There is very good agreement with the expected trends during this time period. The The respiration rate is expected to decrease by 15-25%; however, the observed increase is approximately 10%. This was acceptable due to the trend expressed in other validation resources. The oxygen wall connection loses pressure at 230 seconds. This leads to decreasing oxygen saturation and increasing heart rate and arterial pressures due to the epinephrine response. Following this, the connection is reset to a secondary oxygen tank, and the vital signs return to normal. This behavior matches the validation trends.
 |  |
 |  |
 | |
Table 6 The Nathan scenario displays the effects of sequential bolus fentanyl injection, ventilator mask application, and oxygen wall pressure loss. The engine results show strong agreement with the validation trends.
| Segment | Notes | Action Occurrence Time (s) | Sample Scenario Time (s) | Heart Rate (beats/min) | Systolic Pressure (mmHg) | Diastolic Pressure (mmHg) | Respiration Rate (mmHg) | Oxygen Saturation (mmHg) |
|---|---|---|---|---|---|---|---|---|
| Administer Fentanyl - 150ug | Drug Onset < 2 minutes | 30 | 120 | Stable [127]; 5-10% Decrease [269] | Stable [127]; 5-10% Decrease [269] | Stable [127]; 5-10% Decrease [269] | Decrease [127]; 15-25% Decrease [269] | NC [269] |
| Apply Mask and Turn on Ventilator | 120 | 210 | NC [269] | NC [269] | NC [269] | Slight decrease to due anesthesia machine resistance NC [269] | NC [269] | |
| O2 Wall Pressure Loss | 210 | 340 | If O2 decreases, Increase [269] | If O2 decreases, Increase [269] | If O2 decreases, Increase [269] | NC [269] | If undetected long enough, Decrease [269] | |
| Connect O2 Bottle 1 as O2 Source | 340 | 840 | If above increased, Decrease [269] | If above increased, Decrease [269] | If above increased, Decrease [269] | NC [269] | If above decreased, Increase [269] |
Showcase Scenarios Validation
Four scenarios were created to showcase the ability of the open-source physiology engine to simulate complex and combinatory insults and interventions. The Showcase Scenarios demonstrate the ability of the engine to fill the physiology simulation needs of the medical simulation community.
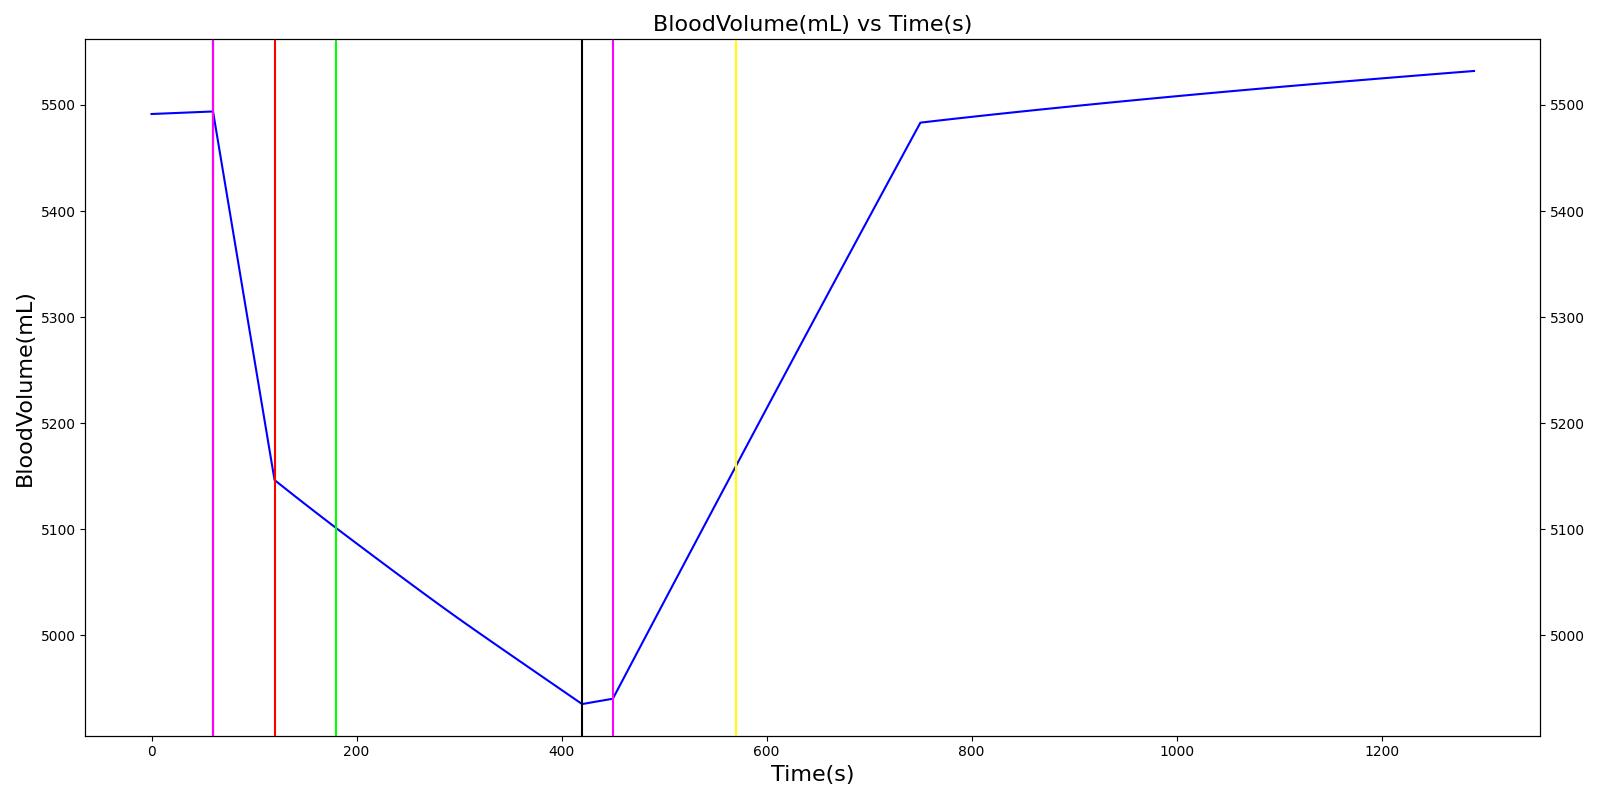
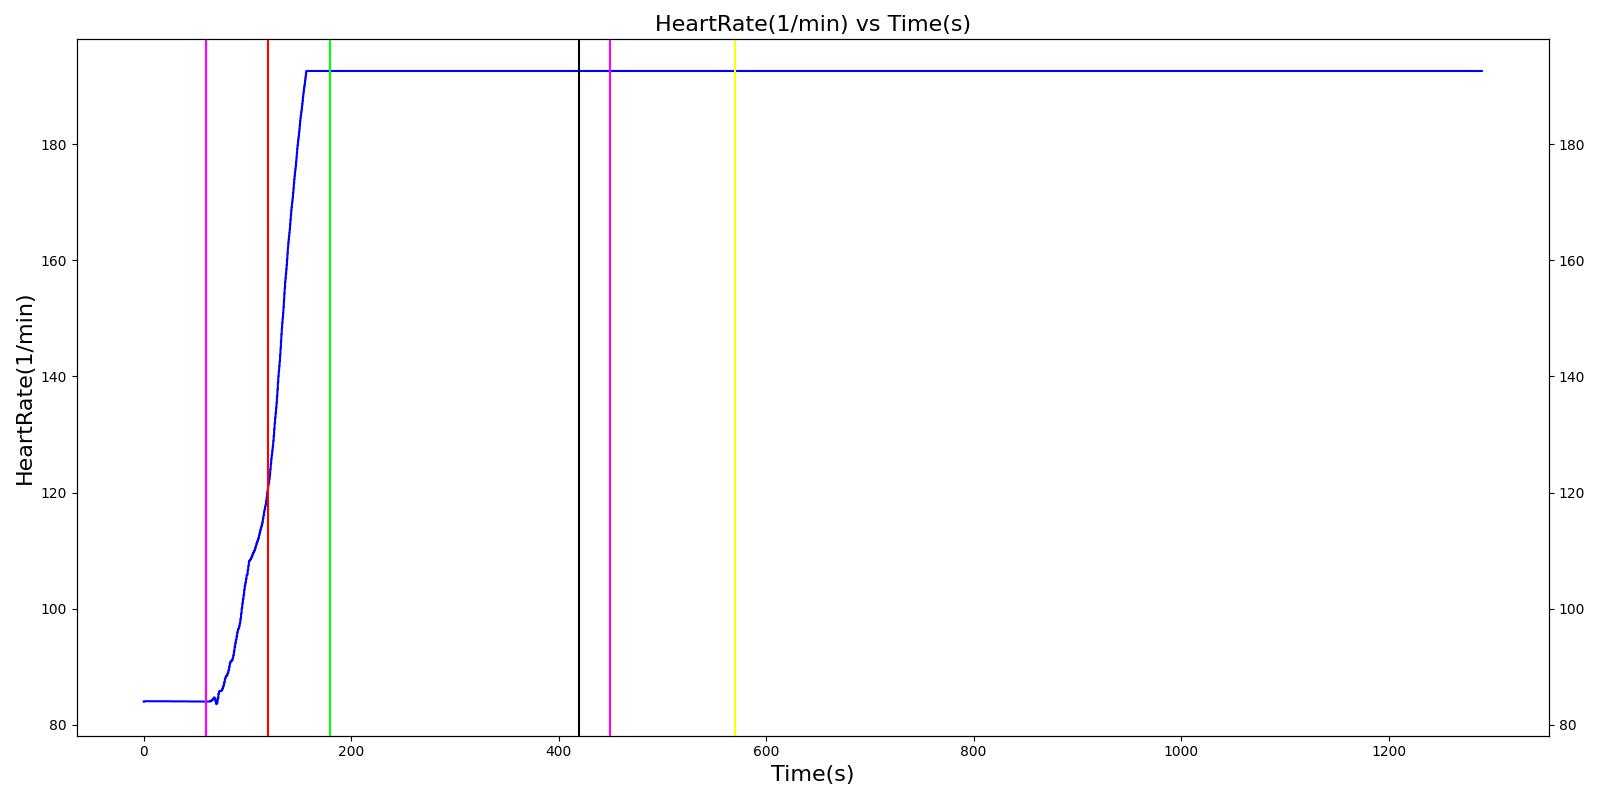
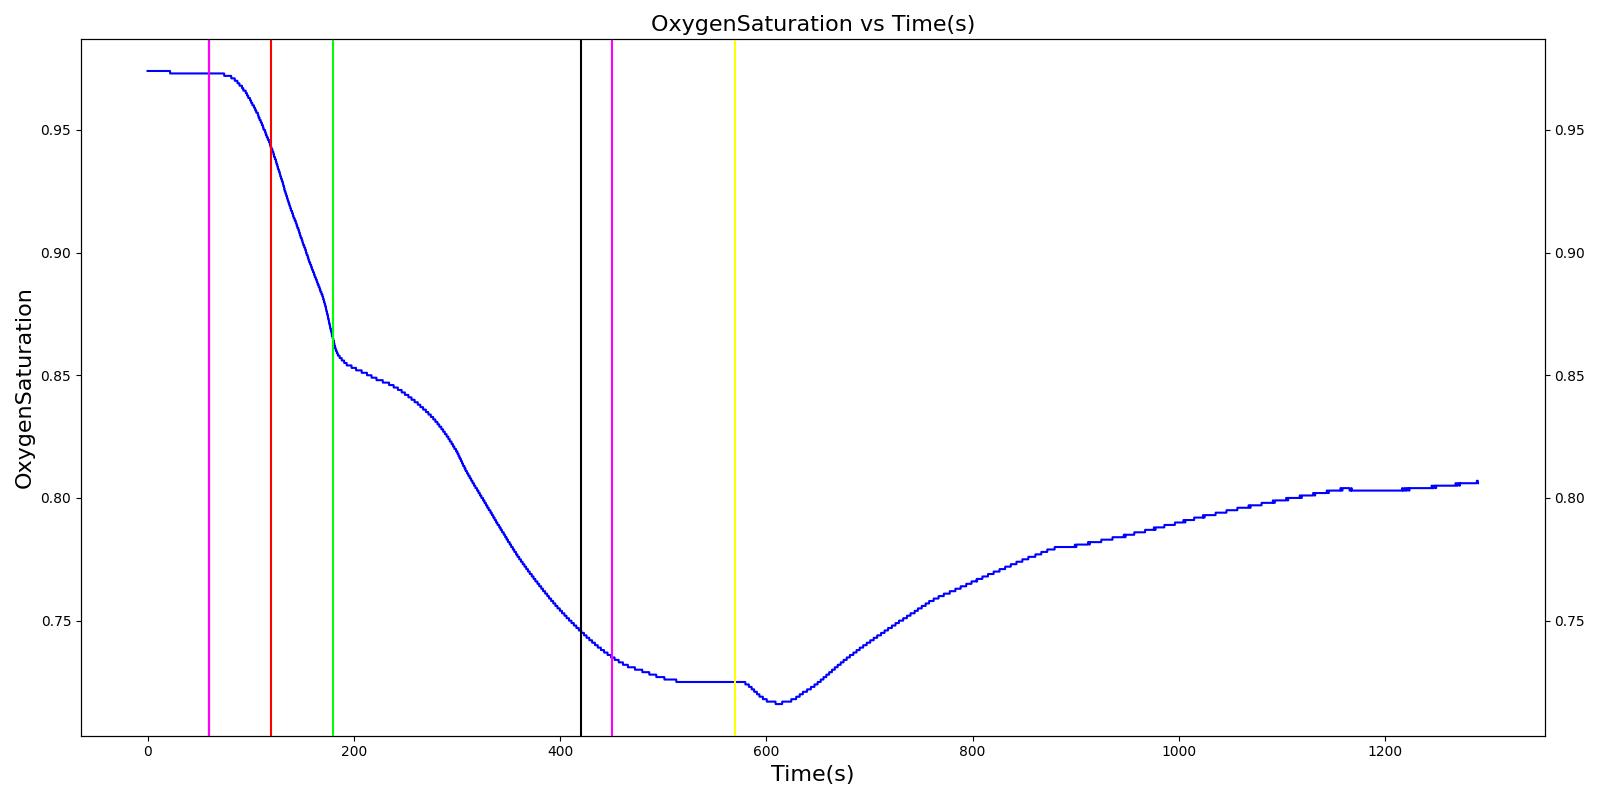
Combat Multitrauma
A team of soldiers is conducting a patrol when an explosive device detonates, injuring one of the soldiers. The squad medic applies direct pressure to a hemorrhaging wound, and, suspecting a tension pneumothorax, performs a needle decompression. Direct pressure is not controlling the bleeding, so a tourniquet is applied. Morphine and IV fluids are administered.
Table 7 The validation results for the Combat Multitrauma Showcase scenario.
| Segment | Notes | Action Occurrence Time (s) | Sample Scenario Time (s) | Heart Rate (beats/min) | Mean Arterial Pressure (mmHg) | Cardiac Output (mL/min) | Mean Central Venous Pressure (mmHg) | Respiration Rate (Breaths/min) | Oxygen Saturation (fraction) | Tidal Volume (mL) |
|---|---|---|---|---|---|---|---|---|---|---|
| Begin Tension Pneumothorax (Left side, closed, severity 0.75) Begin Massive Hemorrhage (Right leg, rate 350 mL/min) | Injuries are untreated. | 60 | 120 | ~25% Increase; [151] Tachycardia [217] | NC or decrease [217] | Decrease [152] | Increase [95] | 40; [60] 14-20; [151] Tachypnea [389] [16] [217] | Decrease [60] [16] [217] [195] | ~25% Decrease [389] |
| Non-tourniquet bleeding control (Manual pressure reduces hemorrhage to 50 mL/min) | A pressure dressing is applied. | 120 | 180 | ~25% Increase; [151] Tachycardia [217] | NC or decrease [217] | Decrease [152] | Increase [95] | 40; [60] 14-20; [151] Tachypnea [389] [16] [217] | Decrease; [60] [195] Plateaus [389] | ~25% Decrease [389] |
| Needle Decompression | A needle decompression procedure is applied on the affected side. | 180 | 420 | 90 - 110 [245] | Decreases [152] | Decrease [152] | NC or Slight Decrease [242] | Back to Baseline [242] | Increase > 0.95 [308] | Back to Baseline [242] |
| Tourniquet (Hemorrhage completely controlled, rate 0 mL/min) | A "tourniquet" is applied to the hemorrhaging leg. | 420 | 450 | 117.9; [195] Possibly no significant change [291] | NC [152] | NC [152] | NC or Slight Decrease [242] | Back to Baseline [242] | Back to Baseline [242] | Back to Baseline [242] |
| Intravenous Fluid Resuscitation (Saline, 500 mL at rate of 100 mL/min) | Saline is administered over 5 minutes at a rate of 100 mL/min. | 450 | 570 | Slight decrease because of partial correction of the hypovolemia; [245] Stress-Induced Moderate Tachycardia [242] | Increase [143] | Increase [152] | Move toward Baseline [242] | Back to Baseline [242] | Back to Baseline [242] | Back to Baseline [242] |
| Narcotics (Morphine) Administration (5 mL of morphine IV at concentration of 1 mg/mL) | A bolus of 5 mg of morphine is administered intravenously. Saline administration continues | 570 | 730 | Decrease [127] | Mild Decrease; [127] Increase [152] | Increase [152] | Mild Decrease [242] | 15-20% Decrease [127] | Decrease [89] | Moderate Decrease [242] |
 |  |
 |  |
 | |
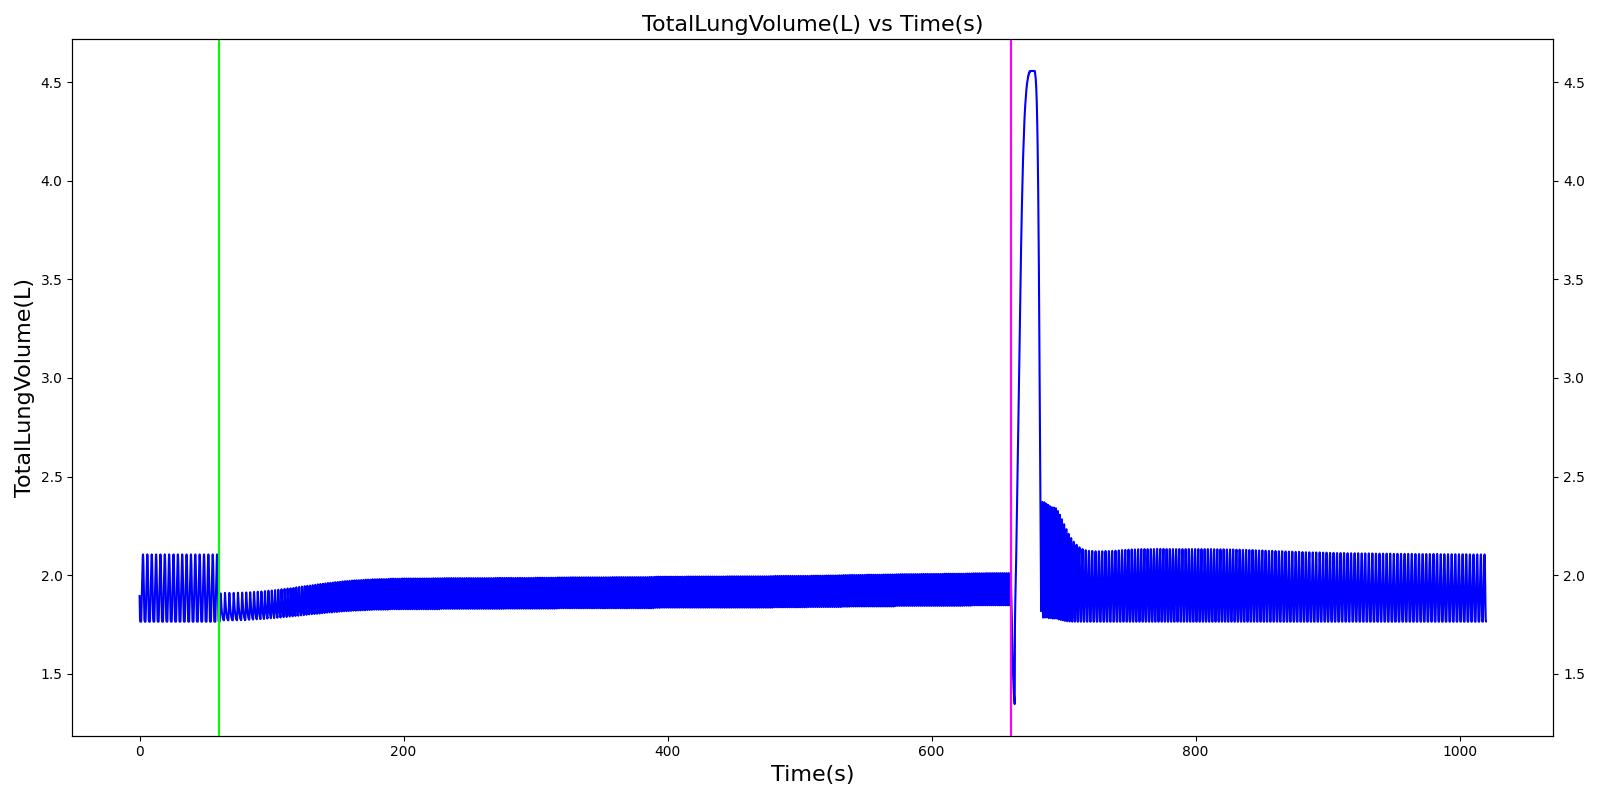
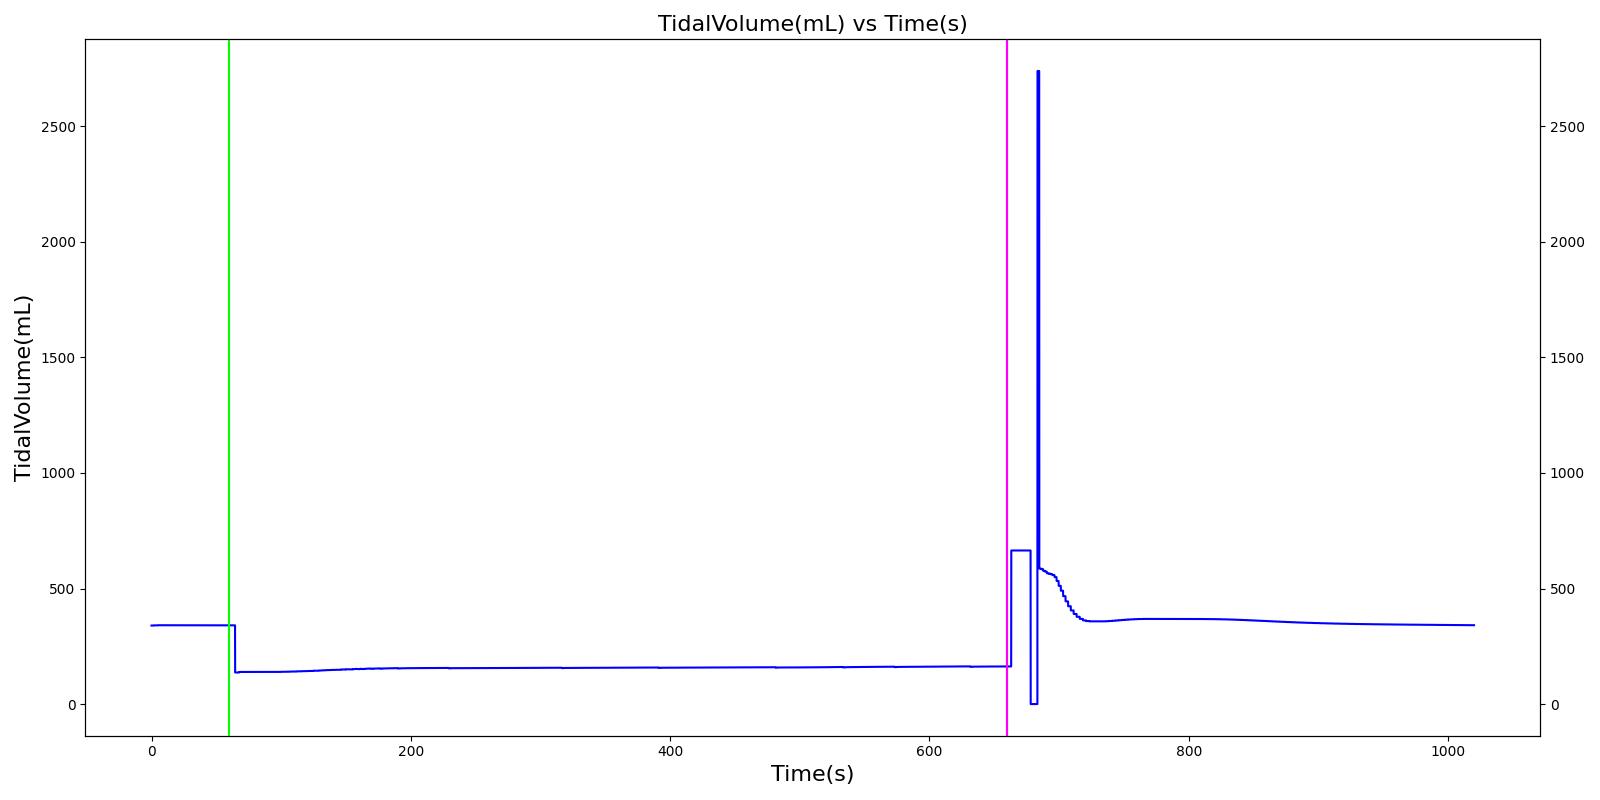
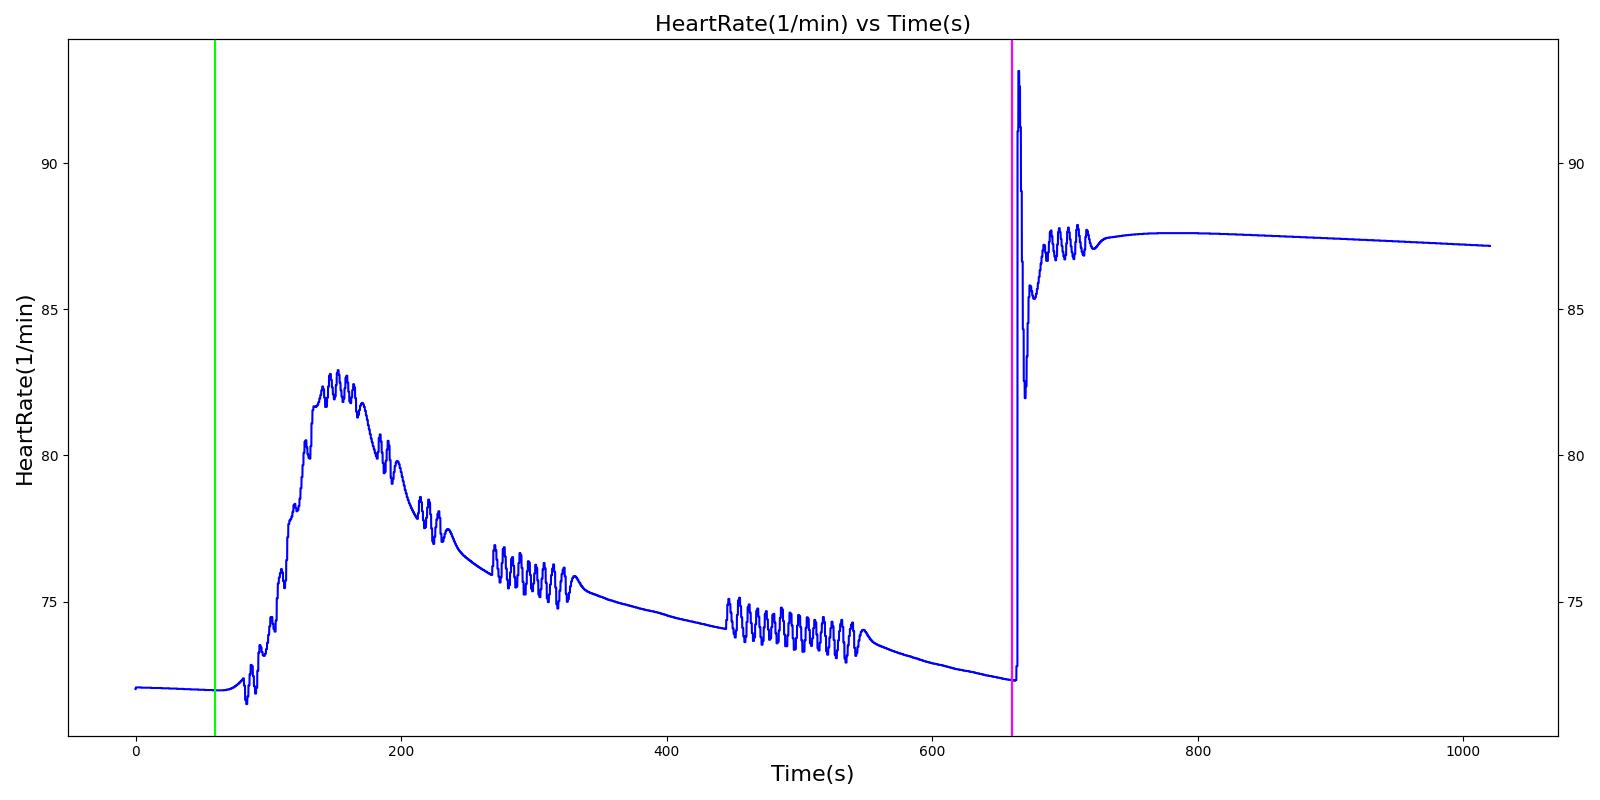
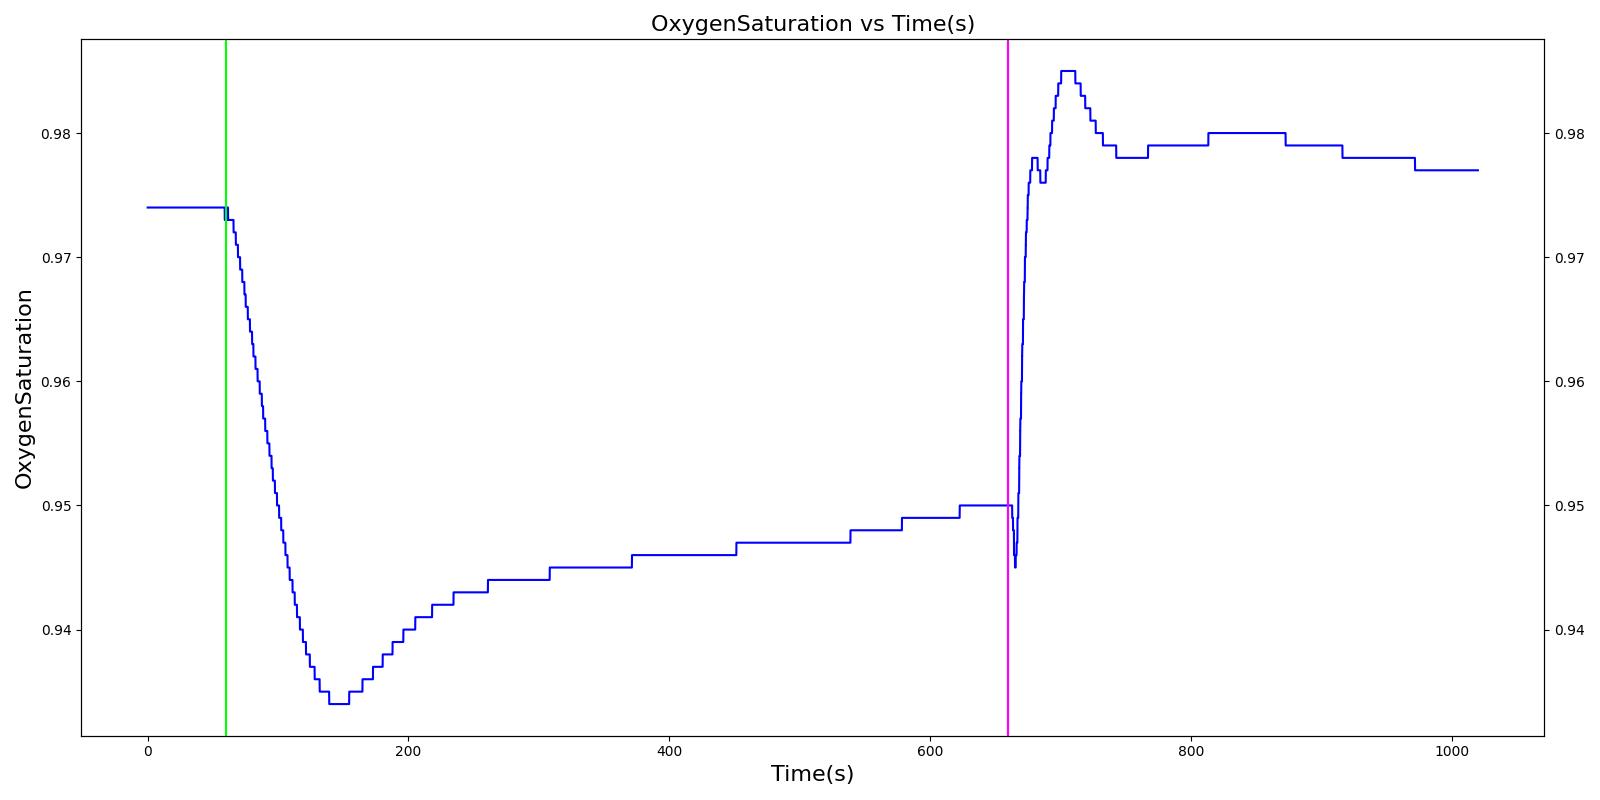
Asthma Attack
A 40 year old female with a history of asthma is having an asthma attack. She arrives at the hospital ten minutes after the beginning of the attack. A doctor administers albuterol and her condition improves.
Table 8 The validation results for the Asthma Attack Showcase scenario.
| Segment | Notes | Action Occurrence Time (s) | Sample Scenario Time (s) | Heart Rate (beats/min) | Heart Stroke Volume (mL) | Mean Arterial Pressure (mmHg) | Systolic Pressure (mmHg) | Cardiac Output (mL/min) | Respiration Rate (breaths/min) | Oxygen Saturation (fraction) | End Tidal CO2 (fraction) | PaO2 (mmHg) | PaCO2 (mmHg) | pH (mmHg) |
|---|---|---|---|---|---|---|---|---|---|---|---|---|---|---|
| Begin Asthma Attack (Severity 0.7) | 10 minutes of asthma attack | 60 | 660 | Increase [6] | Decrease; [242] Decrease is expected with increased heart rate | Increase [6] | Increase [6] | Increase [6] | Increase [6] [297] | Decrease [6] | Decreased peak [267] | 71.5± 12 [267] | 35.8 ±6.9 [267] | Increase [251] [297] |
| Administer Albuterol (Albuterol inhaler used correctly, 90.0 ug dose, nozzle loss fraction 0.04) | Drug Onset in < 5 min | 660 | 960 | Decrease [6] | No Change [242] | Decrease [6] | Decrease [6] | No Change [242] | Decrease [6] [297] | Increase back to baseline [6] | Back to baseline [245] | 78.0 ± 12.7 [267] | 32.3 ± 4.6 [267] | Back to baseline [251] [297] |
 |  |
 |  |
 | |
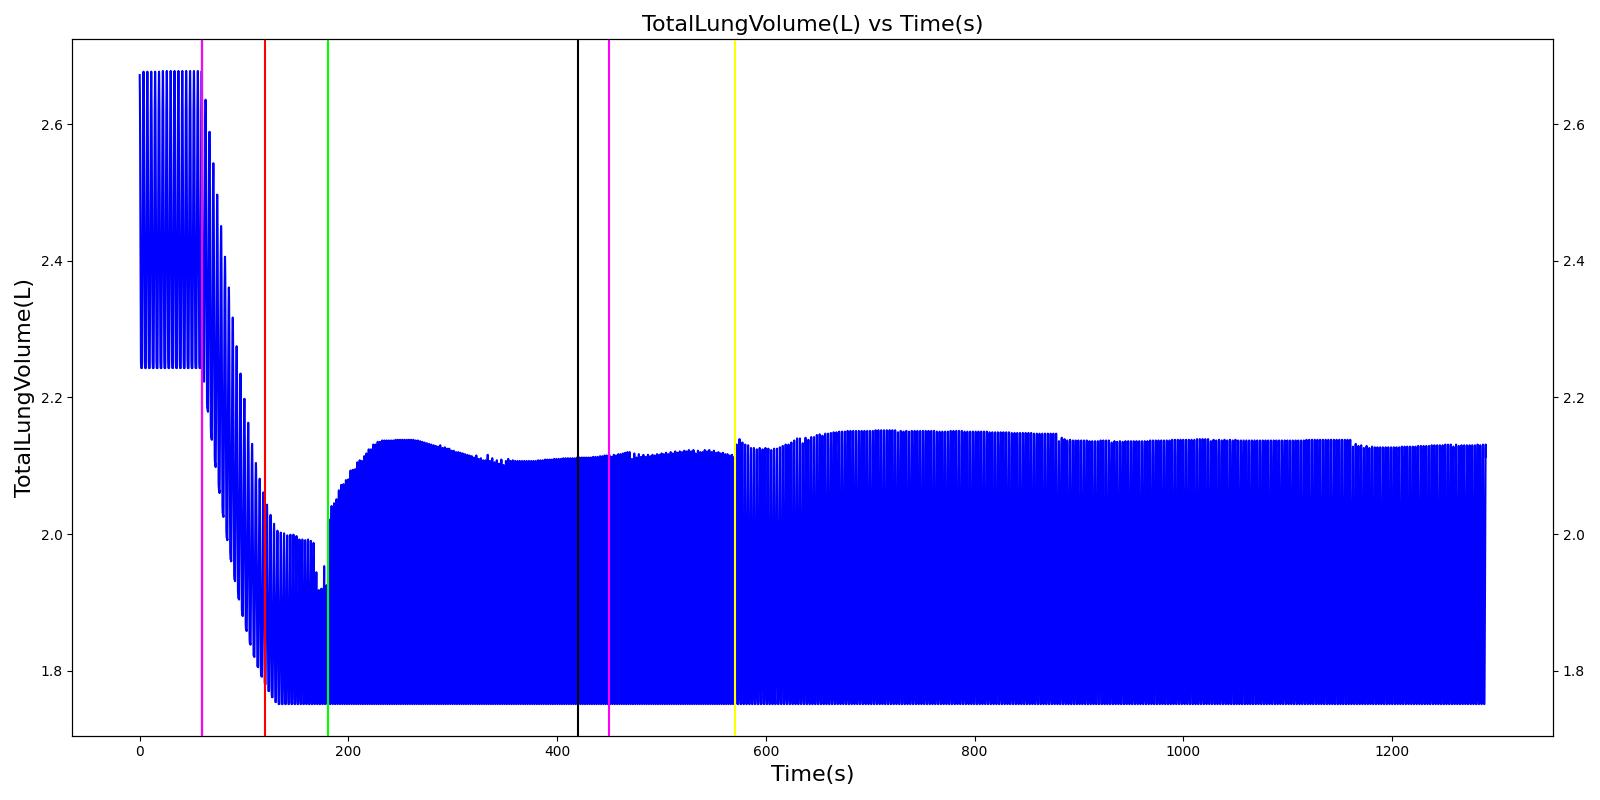
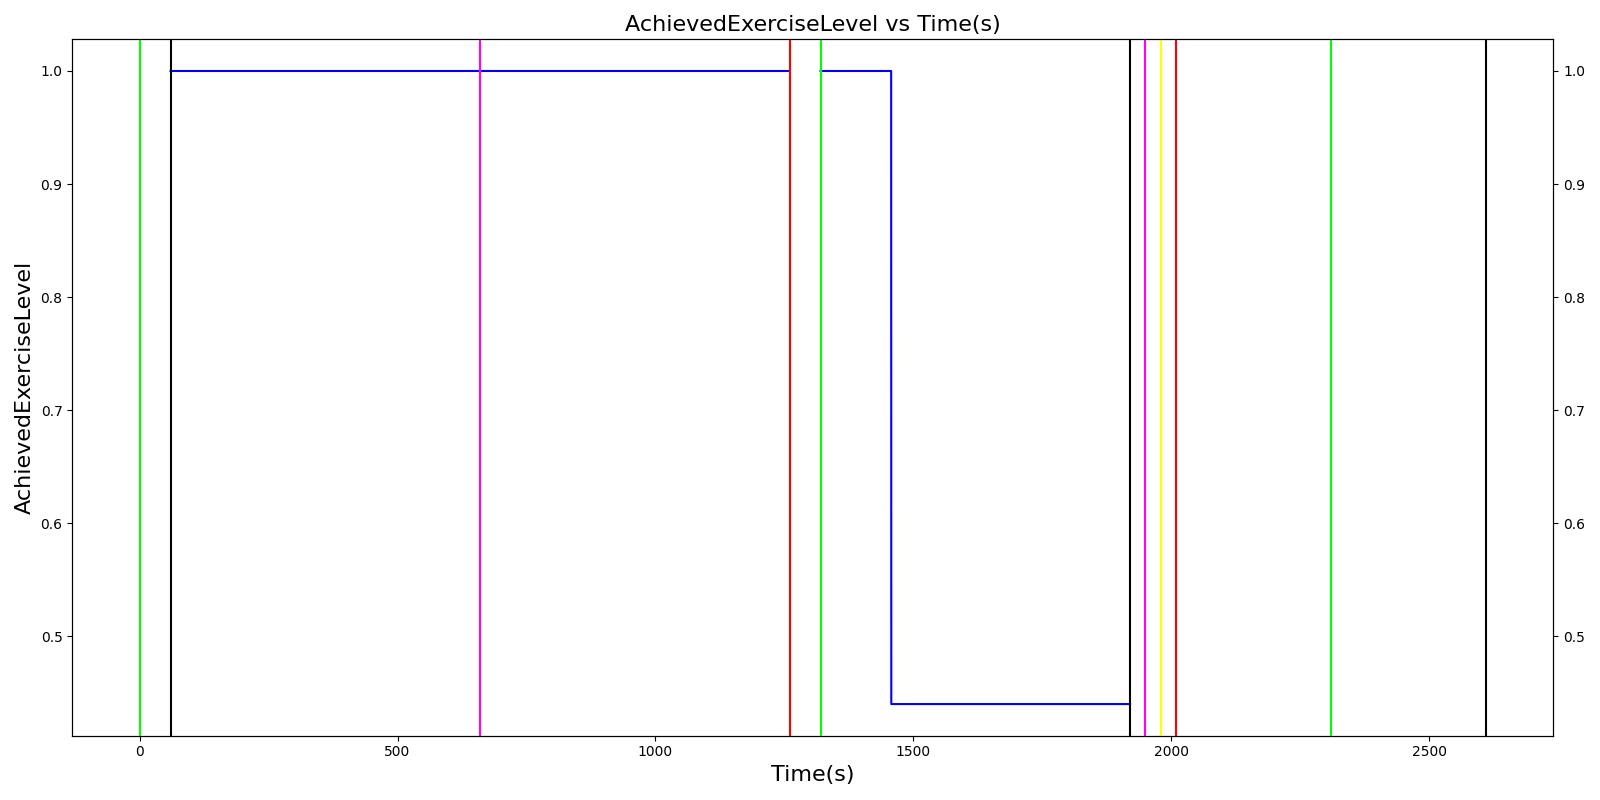
Heat Stroke
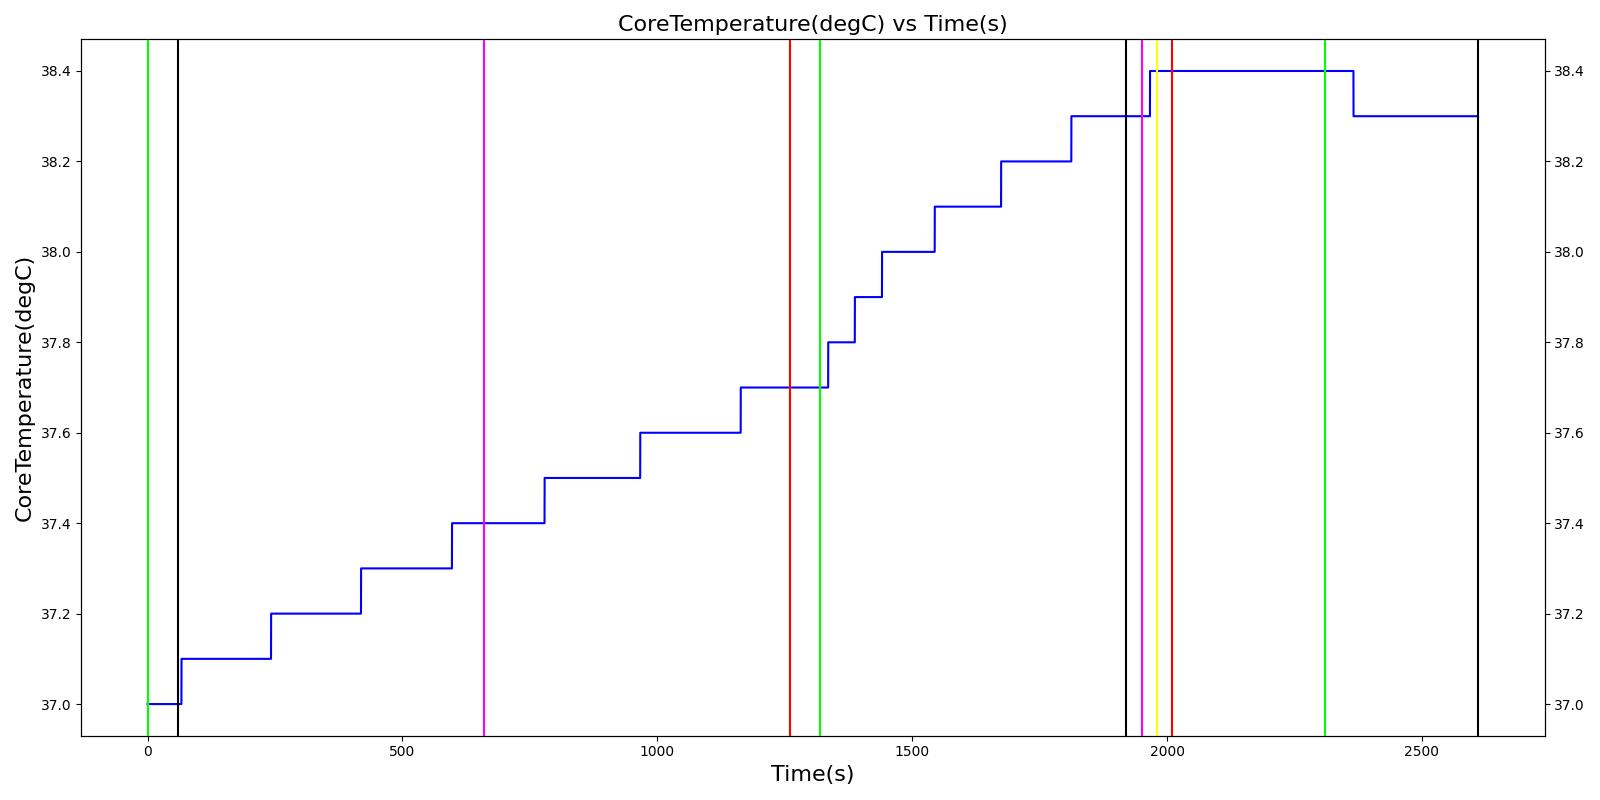
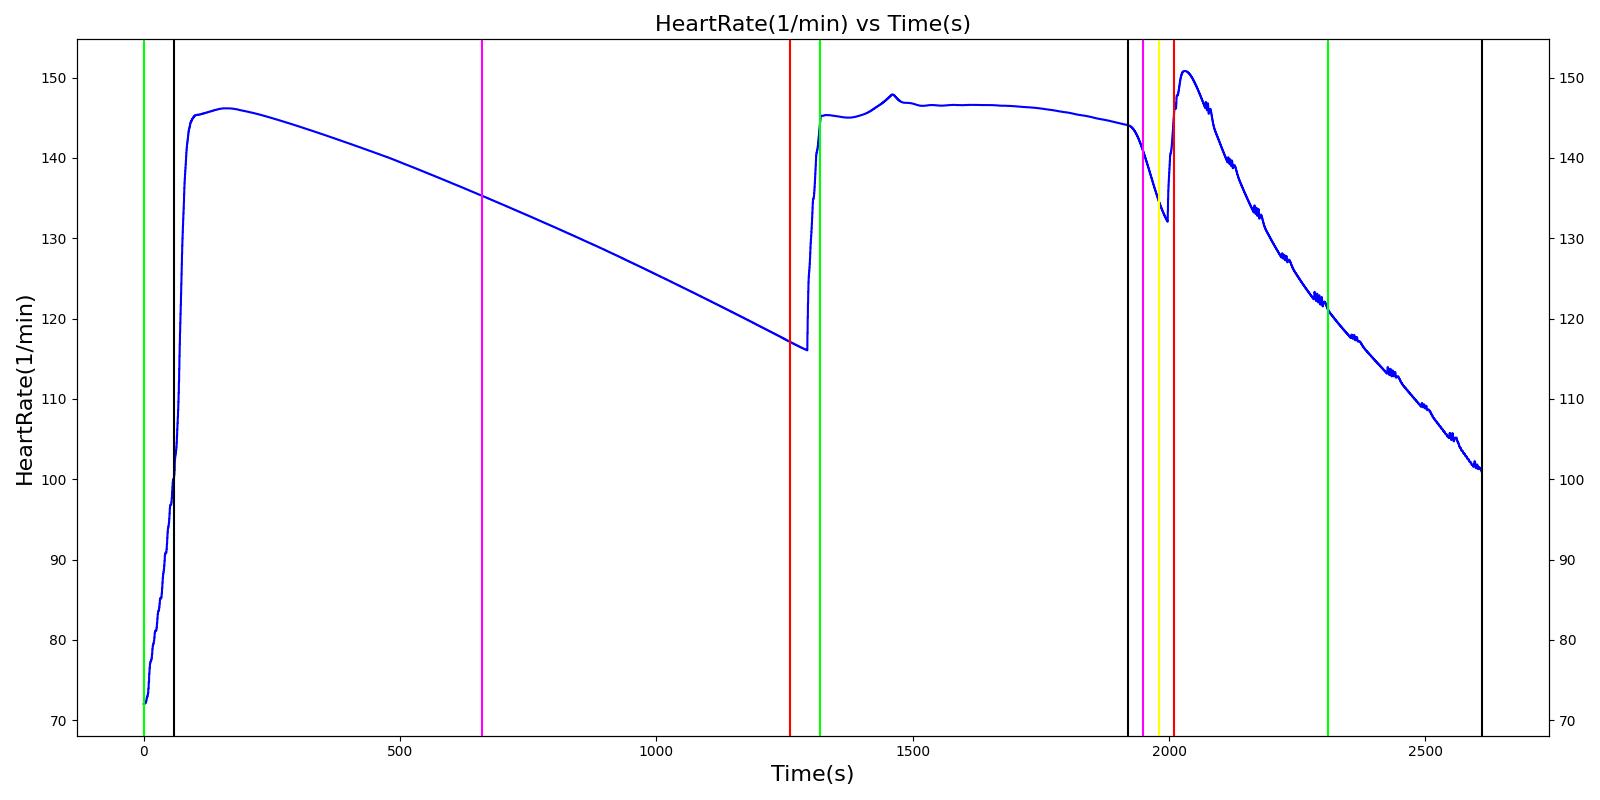
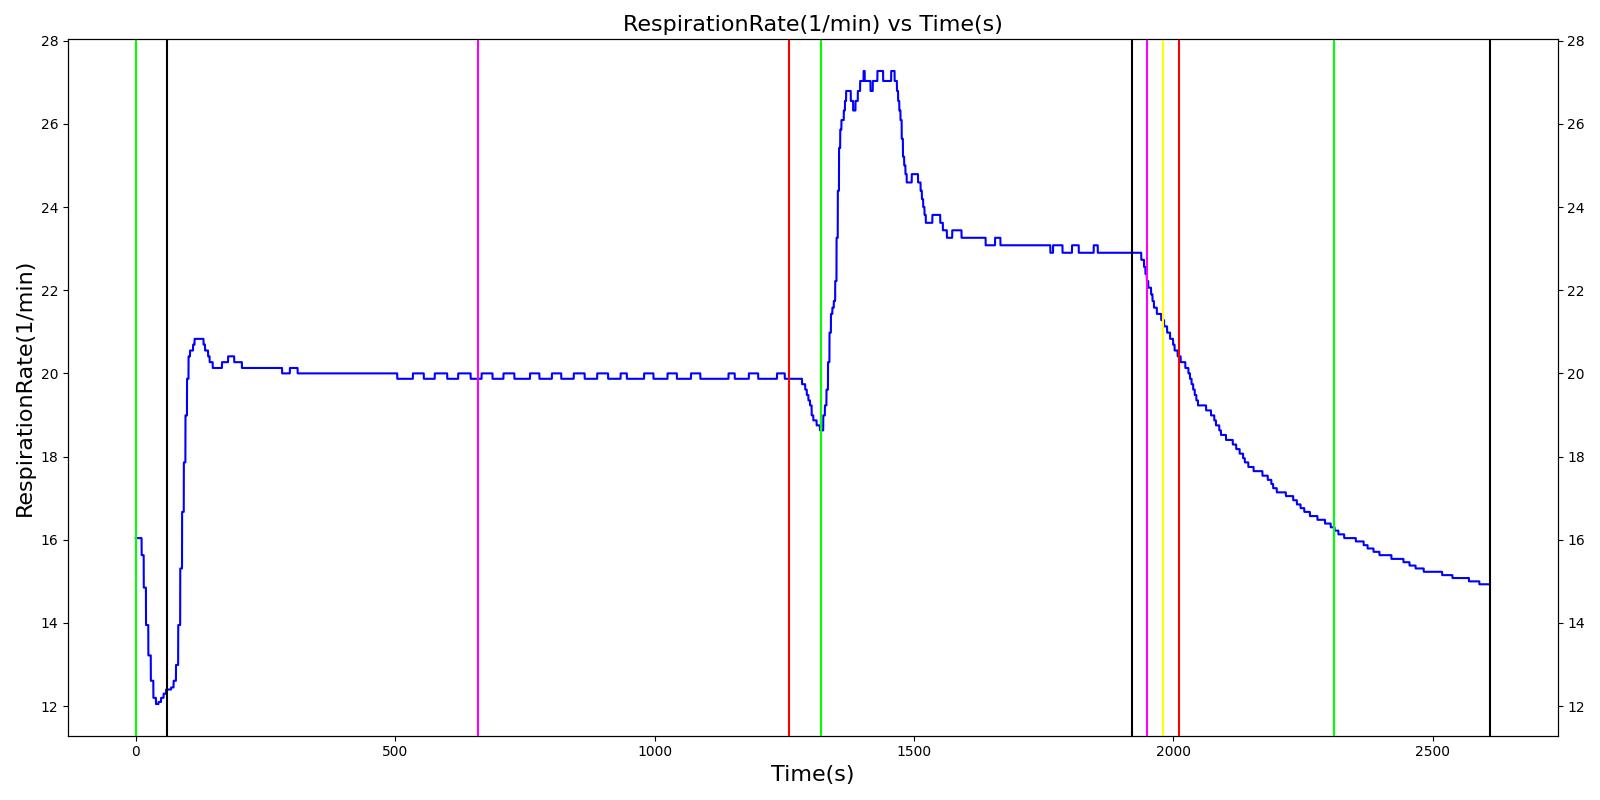
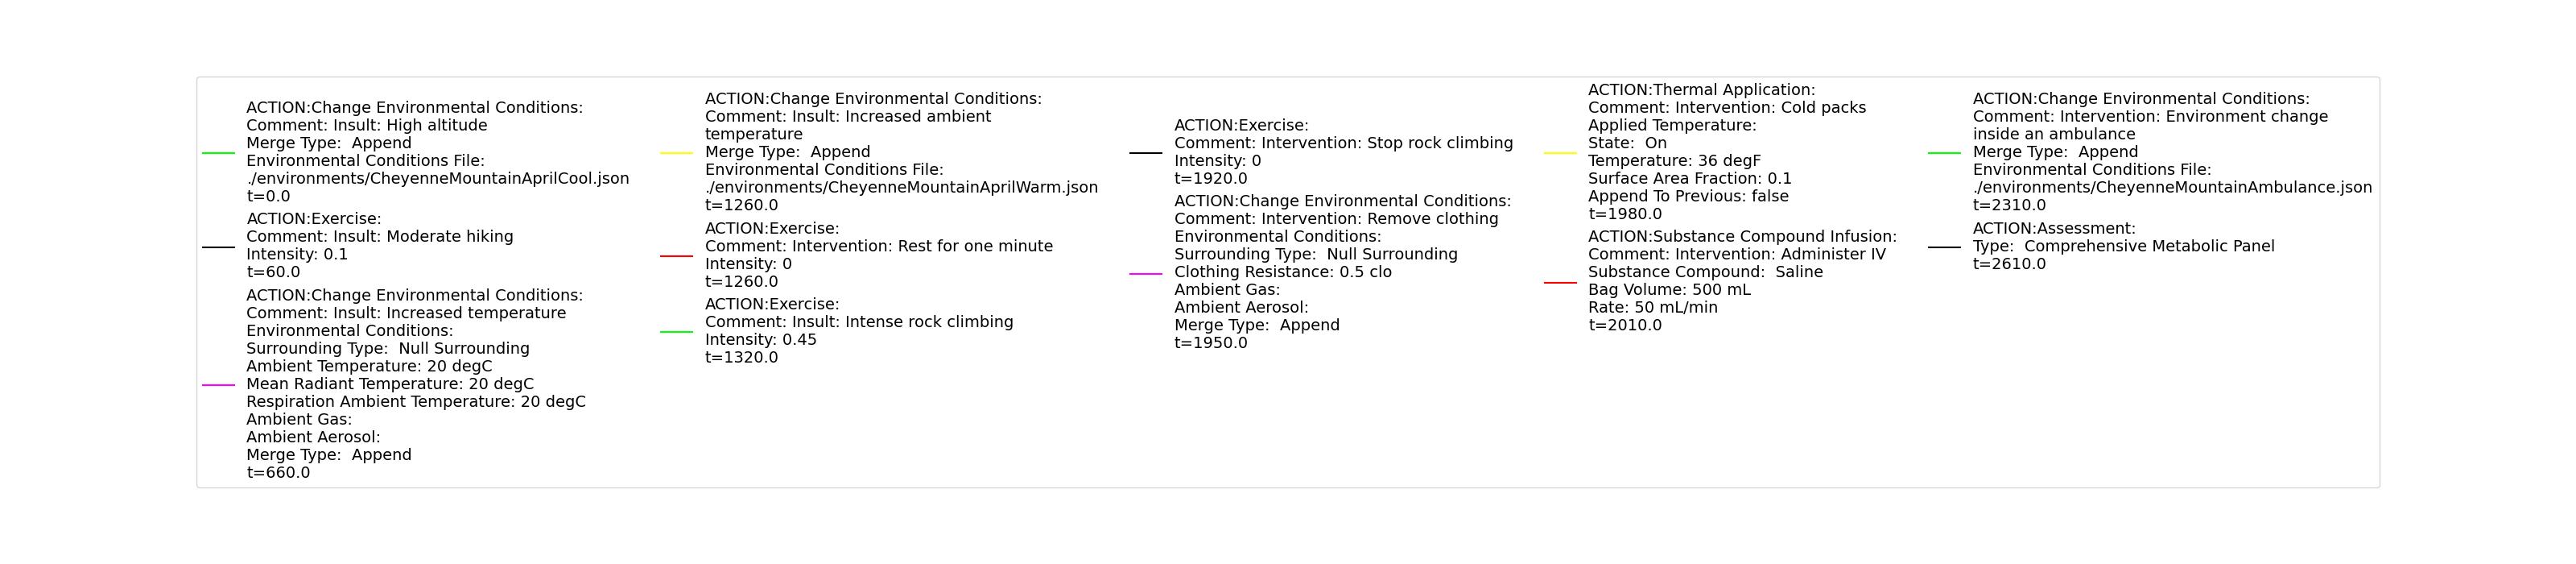
A 25 year old male is hiking towards a rock formation to begin a recreational free climb. During the hike, he is working at ~10% of his maximum capacity. The man arrives at a rock formation and begins climbing at an intensity of ~1/2 of his maximum capacity. At the top of the rock formation, the man becomes dizzy and passes out. An off-duty medic takes action to treat a heat injury.
Table 9 The validation results for the Heat Stroke Showcase scenario.
| Segment | Notes | Action Occurrence Time (s) | Sample Scenario Time (s) | Heart Rate (beats/min) | Heart Stroke Volume (mL) | Mean Arterial Pressure (mmHg) | Systolic Arterial Pressure (mmHg) | Diastolic Arterial Pressure (mmHg) | Oxygen Saturation (mmHg) | Core Temperate (C) | Skin Temperature (C) | Sweat Rate (mL/min) |
|---|---|---|---|---|---|---|---|---|---|---|---|---|
| Hike (Hiking at exercise intensity 0.1) | Exercising heavily for 20 minutes in bulky clothing at an ambient temperature of 16 to 20C | 60 | 1260 | > 80 [245] | Increase [245] | Increase [289] | Increase< 34.4% above resting (168); [61] < 28.8% above resting (161) [289] | No significant change (86) [61], (80) [289] | Decreasing [47] | Increase [245] | < Core [29] | For direct calc = 2.3045e-5*(core-37.1) NOTE this may be low [29] |
| Rest | 1260 | 1320 | Decrease [245] | Some recovery[245] | Some recovery [245] | Some recovery [245] | Some recovery [245] | Some recovery [245] | No change [245] | < Core [29] | No change [245] | |
| Climb (Climbing at exercise intensity 0.45) | Heat stroke is evident after 10 more minutes of exercise at a rising temperature | 1320 | 1920 | 120 - 180 [289] | 121.9; [268] 101 - 121 [61] | Increasing [289] then decreasing with heat stroke [268] | Increase toward max exertion values 34.4% above resting (168); [61] 28.8% above resting (161) [289] | No significant change (86); [61] (80) [289] | Decreasing [47] | >40 degC [39] | < Core [29] | For direct calc = 2.3045e-5*(core-37.1) NOTE this may be low [29] |
| Bystander Actions (Move to cooler environment, remove clothing, apply cold pack, and start IV fluids) | The patient's clothing is removed. IV saline is administered and active cooling begun. | 1920 | 2010 | Decreasing (to baseline over 12 hours) [268] | Decreasing (to baseline over 12 hours) [268] | Decrease [268] | < 120 [39] | No significant change (86); [61] (80); [289] Possible slight decrease [39], [29] | Increase [245] | Decreasing with treatment [245] | < Core [29] | For direct calc = 2.3045e-5*(core-37.1) NOTE this may be low [29] |
| Transportation | The patient is transported to a medical treatment facility. | 2010 | 2610 | Decreasing (to baseline over 12 hours) [268] | Decreasing (to baseline over 12 hours) [268] | Decrease [268] | < 120 [39] | No significant change (86); [61] (80); [289] Possible slight decrease [39] [29] | Increase [245] | Decreasing with treatment [245] | < Core [29] | For direct calc = 2.3045e-5*(core-37.1) NOTE this may be low [29] |
 |  |
 |  |
 | |
Environment Exposure
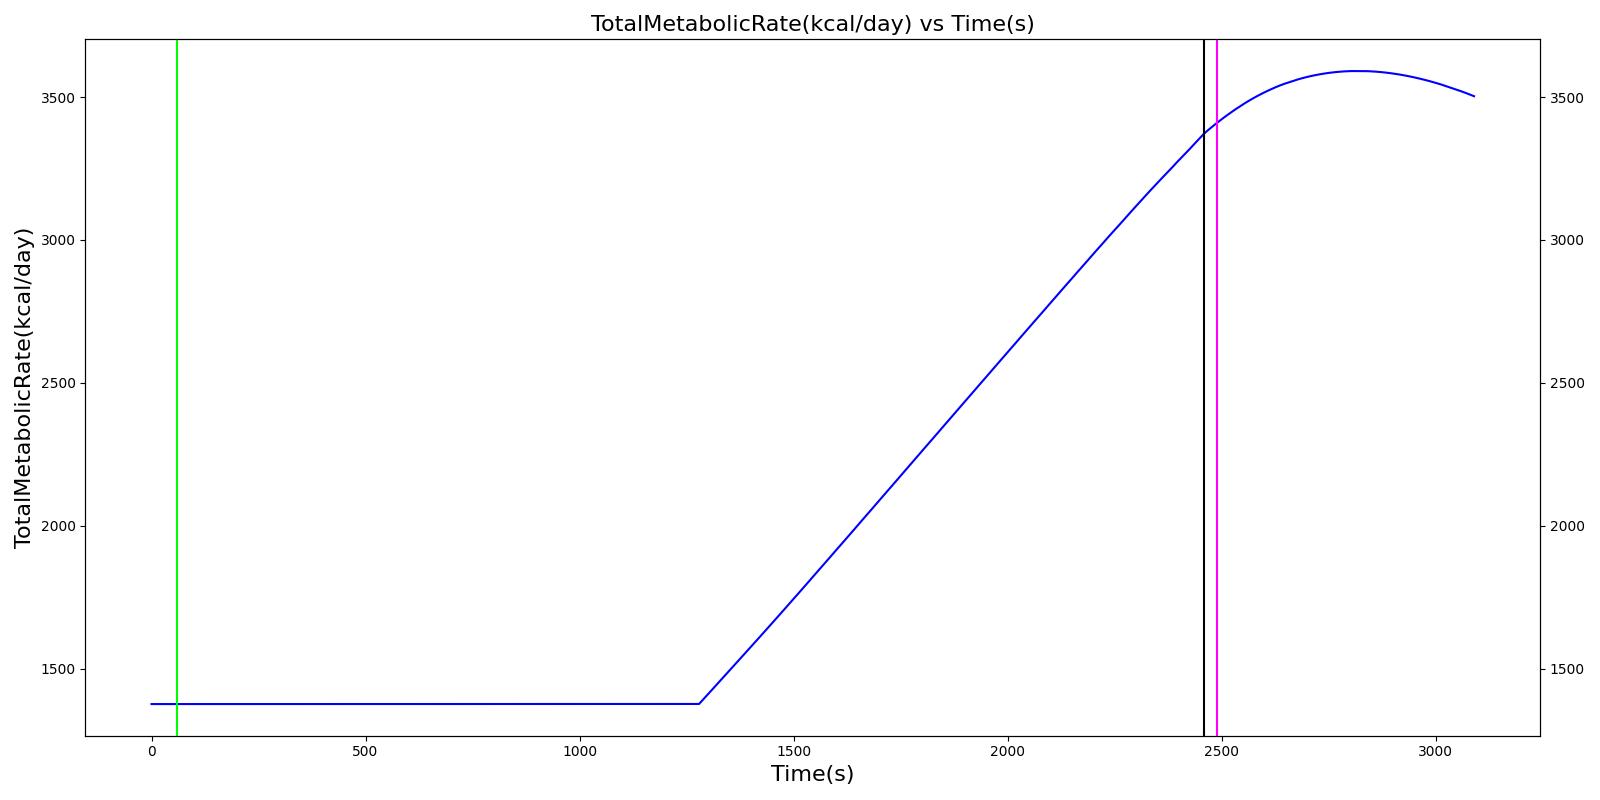
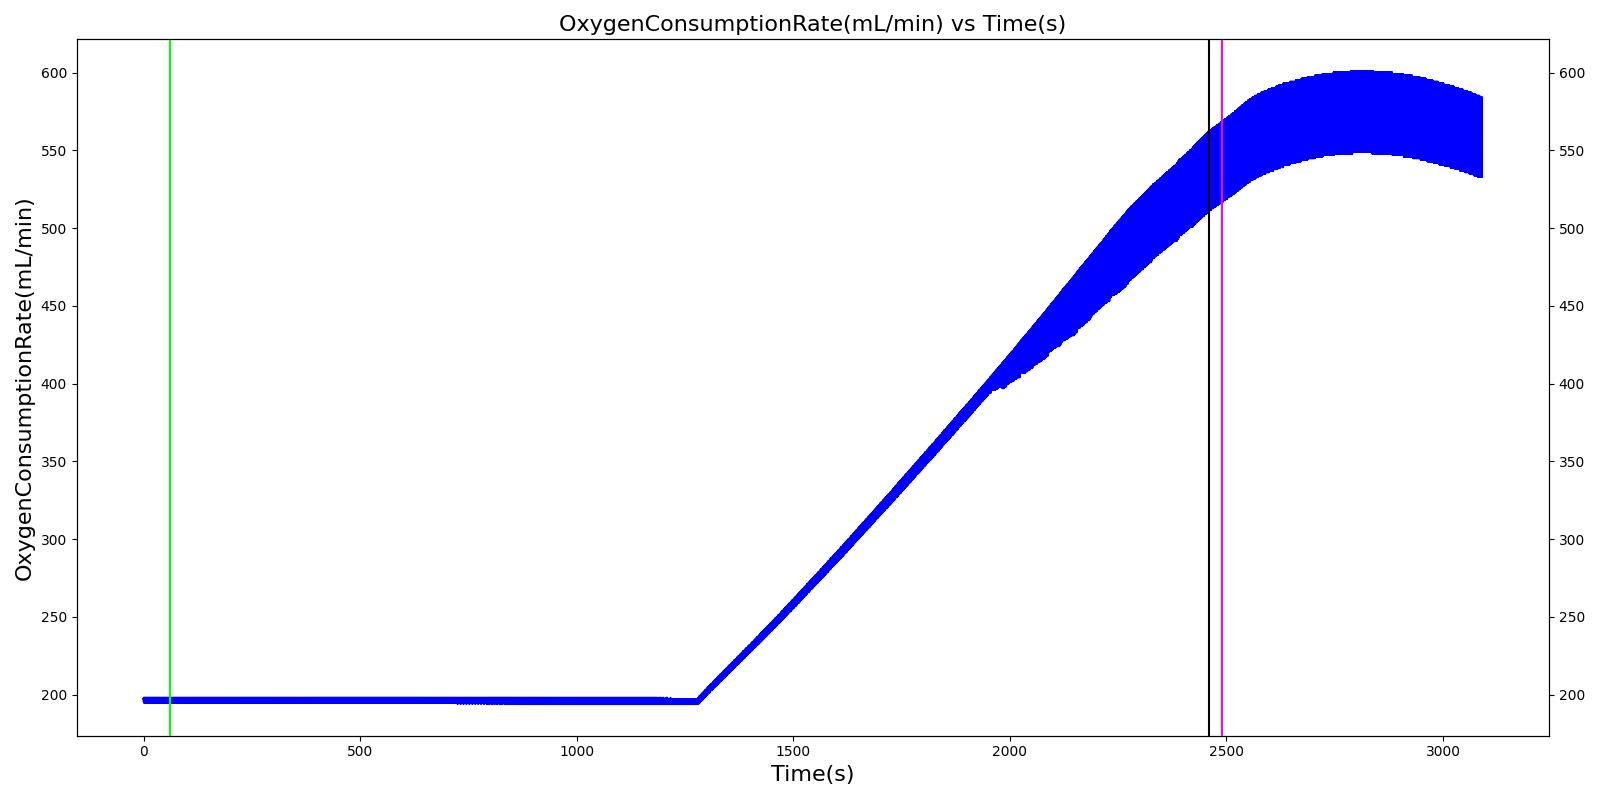
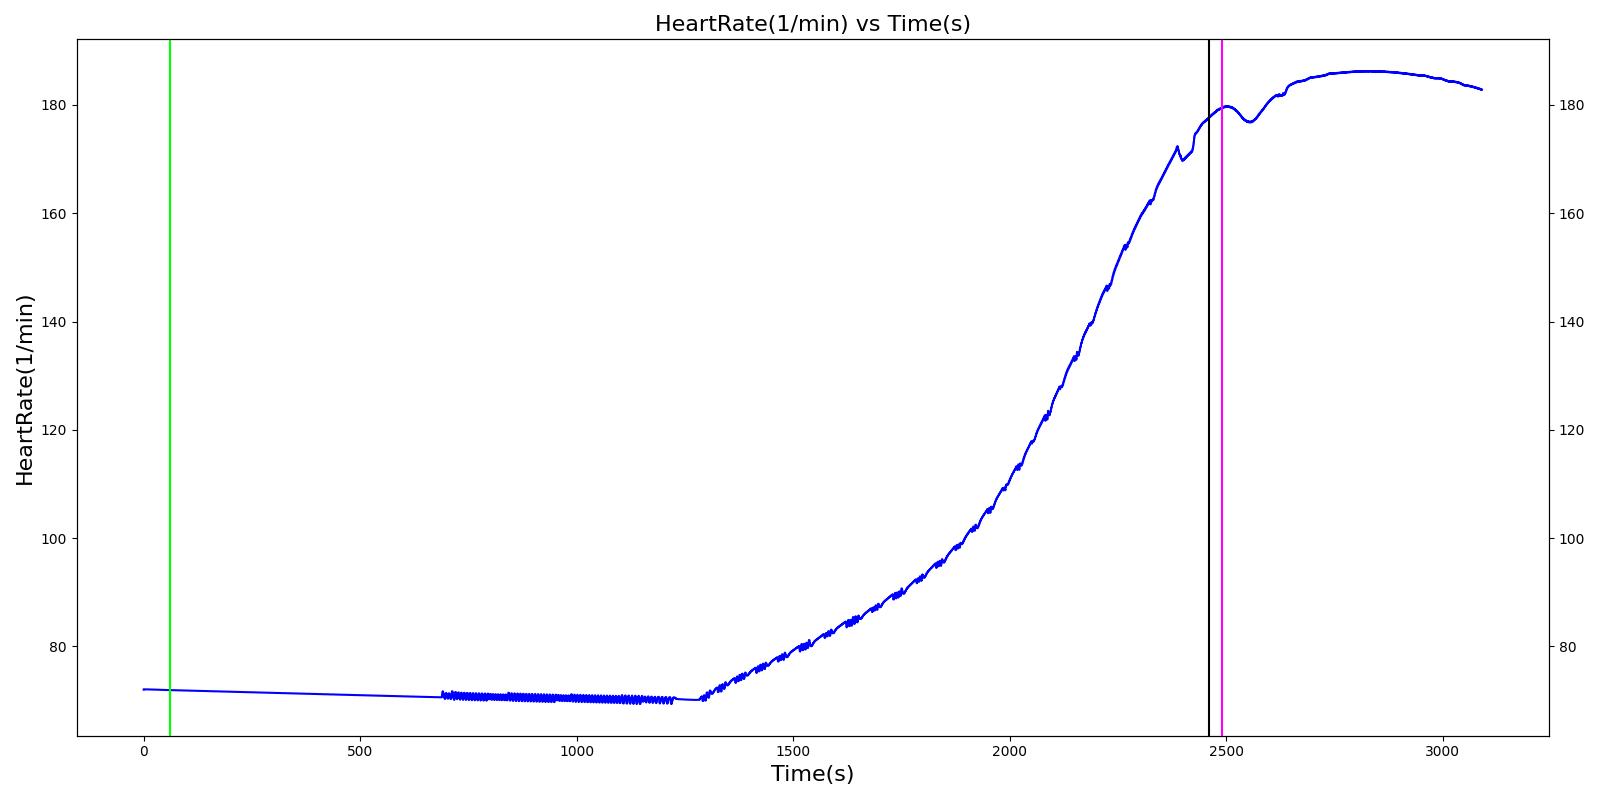
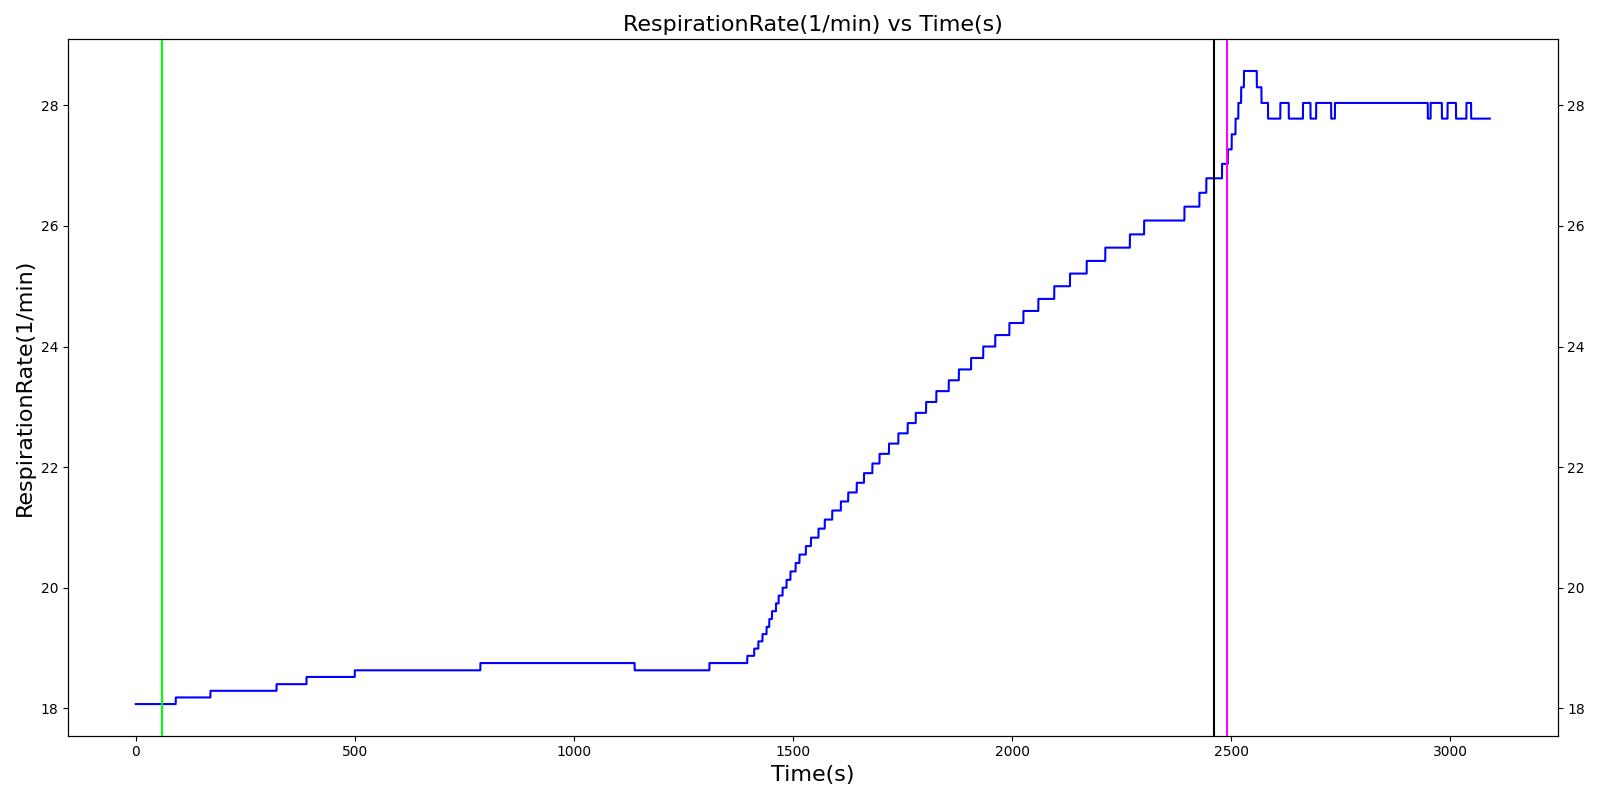
A 17 year old female leaves her Alaskan home in the mid-winter to retrieve a newspaper. The door closes as she exits the house. She is stuck outside for 45 minutes where it is -10oC. When the woman's housemates realize that she is outside, they bring her back in and sit her next to a fire.
Table 10 The validation results for the Environmental Exposure Showcase scenario.
| Segment | Notes | Action Occurrence Time (s) | Sample Scenario Time (s) | Heart Rate (beats/min) | Mean Arterial Pressure (mmHg) | Systolic Arterial Pressure (mmHg) | Respiration Rate (Breaths/min) | Core Temperature (C) | Oxygen Consumption (mL/min) | Carbon Dioxide Production (mL/min) | Metabolic Rate (W) |
|---|---|---|---|---|---|---|---|---|---|---|---|
| Cold Exposure (Environment change to Alaska outdoors for 10 minutes) | Patient exposed to very low temeratures for 10 minutes | 60 | 2460 | Increase initially then decrease [233] | Small rise then gradual fall below baseline [302] | Small rise then gradual fall below baseline [302] | Increasing [233] | < 35 [302] | Decrease in hypothermia; [302] 1130 - 1320 with light activity [167] | Decrease in hypothermia [302] | Approximately 350% increase over BMR (304.38 W for this patient) [403] |
| Active Heating and Additional Clothing (Environment change to indoors and active heating applied to skin) | Patient indoors and actively heated for 10 minutes | 2460 | 3090 | Back toward baseline [245] | Increasing back to baseline; [302] Back to baseline [245] | Increasing back to baseline reuler1978hypothermia | Decreasing to baseline [233] | > 35 [302] | Increase [302] | Increase [302] | Back toward baseline [245] |
 |  |
 |  |
 | |
Conclusion
The engine has successfully leveraged the CDM to model and simulate whole body physiology. The interaction of the existing system models was validated by looking at the combined effects of multiple actions on a variety of patients. Virtually everything within the engine is modular and extensible. Fidelity can be changed at any level within the system. The engine is a fully standalone simulator, but can also implement or interface with external software.
Recommended Improvements
An area of potential future advancements for the engine includes the integration of differing time step and un-fixed time step models. This could be achieved through simple interpolation and down-sampling, where applicable. Other advanced system dynamics, adaptive step sizes, and mixed fidelity techniques could also be investigated.
Investigations into the effects of biological variability and parameter (inputs and outputs) error bound and confidence intervals could be applied throughout.
Appendices
Glossary
CDM - Common Data Model
ECG - Electrocardiography
CFD - Computational Fluid Dynamics
PBPK - Physiologically-Based Pharmacokinetic
SME - Subject Matter Expert