Overview
Abstract
The Energy system provides a methodology for both thermal and metabolic regulation within the body. Heat transfer is modeled by a body thermal circuit that is connected to the environment circuit. A heat source at the core of the body circuit represents the metabolic heat production. In addition to generating heat, the dynamic metabolic rate is also used to compute the metabolic production and consumption rates of gases and other substances in the body. This system has been validated both under resting and dynamic conditions, such as exercise and external environment changes.
Introduction
The Energy system is responsible for simulating metabolism and regulating internal temperature. Metabolism is simulated through the consumption of nutrients in the tissues. Glucose and fat are the nutrients most readily used as an energy source for the human body. Oxygen is used to metabolize these nutrients during aerobic metabolism. After entering the pulmonary capillaries, oxygen is transported via the circulatory system and diffuses into the tissue where it is used in the aerobic reaction. The resulting by-product, carbon dioxide, diffuses out of tissue, traveling through the circulation before exiting the body through the pulmonary capillaries [152]. Glucose can also be used to produce energy under anaerobic conditions, and lactate (lactic acid) is the resulting by-product. The lactate enters the circulation and can be reconverted to glucose via gluconeogenesis in the liver and kidneys. During periods of prolonged starvation, the liver produces ketoacids. Acetoacetate is the predominant ketone synthesized. After it is produced, acetoacetate may be used as an energy source for the brain, myocardium, and muscle [146].
The body's temperature is well-regulated. Core temperature regulation can be achieved by varying heat production (e.g. shivering) or heat exchange (e.g. sweating). In the engine, variations in the external environment or physical activity can lead to changes in the core temperature, triggering thermal feedback. Examples of thermal feedback during shifts in core temperature are sweating and shivering. Sweating is initiated if the core temperature is too high [167]. The increased evaporation of water from the surface of the skin leads to an increase in heat transferred out of the body. Changes in core temperature directly affect other systems. For example, a low core temperature causes blood flow to be shunted away from the skin, resulting in less heat transfer from the core to the skin [152]. These feedback mechanisms are used to maintain thermal homeostasis in a variety of environmental conditions.
System Design
Background and Scope
Requirements
The energy system is required to simulate the effects of exercise and elevated physical activity as well as react to temperature and pressure changes in the environment.
Approach
The Energy system is a physical model of heat transfer combined with a collection of empirical equations for heat production and exchange obtained from literature. Additional equations are derived from stoichiometric relationships and empirical data found in the literature, particularly the governing equations for the metabolic production and consumption of substances. It uses a thermal circuit to simulate heat transfer through the body, with the body circuit connected to the environment circuit. The body thermal circuit consists of a core node, representing core temperature, and a skin node, which represents the lumped peripheral temperature. The body thermal circuit is shown in Figure 1.
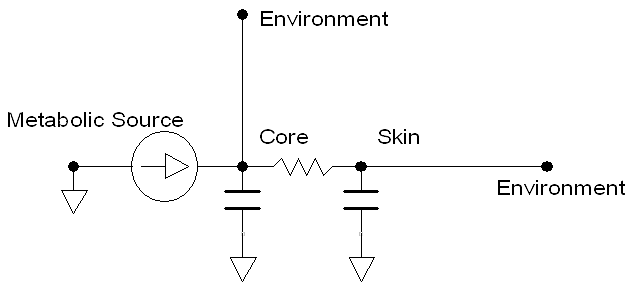 Figure 1 The body thermal circuit consists of two nodes and four paths. Two additional paths exist, connecting to the environment thermal circuit. The circuit is used to model the dynamic core and skin temperatures.
The path elements consist of an internal heat flow source, a core heat capacitance, a skin heat capacitance, and a variable resistor from the core to skin. These four elements represent metabolic heat generation, the discretized heat capacity of the human body, and the convective heat transfer due to blood flow. The heat capacities of the core and skin are computed by proportioning the mass-averaged heat capacity found in literature based on the mass fraction of the skin [167]. The variable core to skin resistance is computed dynamically during simulation, and is inversely proportional to the skin blood flow. A decrease in blood flow leads to an increase in heat transfer resistance, and vice versa. When connected to the environment thermal circuit, the core and skin temperatures dynamically react to the environmental conditions (e.g. temperature, pressure, and humidity).
The metabolic production and consumption of the Energy system is a set of calculations that determine the rate of change of substances (nutrients, ions, gases) in the tissue, relying on advective and diffusive transport methodologies.
Thermal Regulation
Thermal regulation in the Energy system occurs through manipulation of the metabolic rate or through external losses (sweating). The thermal feedback mechanisms are a direct implementation from those discussed by Herman [167]. For high core temperature, a control equation specifies the sweat rate as a function of the difference between the current core temperature and the set-point (Equation 1). Sweat is removed from the body via a path connected between the skin and the environment (Figure 2). Note that sweat is currently composed of water only, a known limitation which will be addressed in the future.
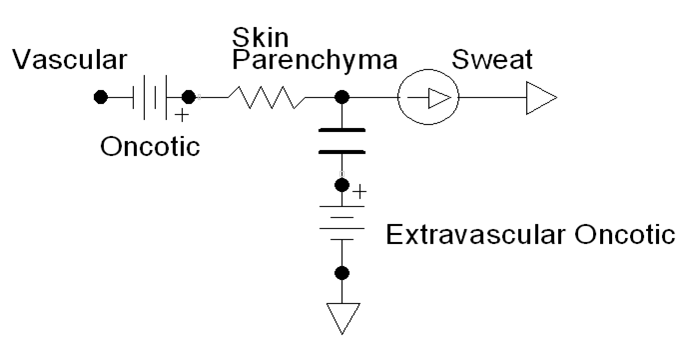 Figure 2 Sweat is removed from the body via a flow source path connected to ground. The flow source rate is computed using Equation 1.
![\[ \dot{m}_{sweat} = \frac{h_{sweat} \left(T_{core} - T_{core,setpoint} \right)}{\rho_{sweat}} \]](form_32.png)
For severe increases in core temperature (hyperthermia), the rate of chemical reactions can increase, leading to a subsequent rise in metabolic rate. This value was quantified from Pate et al. [229] as an eleven percent increase in metabolic rate for every degree increase in core temperature. This is described from the power relationship between metabolic rate and core temperature, shown in Equation 2.
![\[ \dot{Q}^{n+1}_{metabolic} = \dot{Q}^{n}_{metabolic} * \left(1.11 \right)^{T_{core}-T_{core,high}} \]](form_33.png)
For low core temperatures, the maximum metabolic rate achievable through shivering is defined from the summit metabolism. This value is given by Herman as:
![\[ \dot{Q}_{metabolic} = 21.0m^{0.75}_{b} \]](form_34.png)
If the summit metabolism is not enough to adequately maintain internal temperature, then the metabolic rate will begin to decrease at a rate of six percent for every degree drop [232]. The power relationship in Equation 4 is used to describe this phenomenon.
![\[ \dot{Q}^{n+1}_{metabolic} = \dot{Q}^{n}_{metabolic} * \left(0.96 \right)^{T_{core,low}-T_{core}} \]](form_35.png)
Under resting conditions, the metabolic rate is determined from the Harris-Benedict formula. This formula gives the metabolic requirements in kilo-calories per day as a function of weight, height, age, and sex [323] . This empirical formula is shown in Equation 5.
| Men: |
|
| Women: |
|
![\[ \dot{Q}_{metabolic} = 88.632 + 13.397*m_{b} + 4.799*H - 5.677*A \]](form_36.png)
![\[ \dot{Q}_{metabolic} = 447.593 + 9.247*m_{b} + 3.098*H - 4.330*A \]](form_37.png)
Data Flow
The Energy System determines its state at every timestep through a three-step process: Preprocess, Process, and Postprocess. In general, Preprocess determines the circuit element values based on feedback mechanisms and engine settings/actions. Process uses the generic circuit calculator to compute the entire state of the circuit and fill in all pertinent values. Postprocess is used to advance time.
Preprocess
Calculate Metabolic Heat Generation
The metabolic rate is dictated by the current state of the core temperature. This function includes states of increased metabolic rate due to shivering or severe hyperthermia. Additionally, an extreme drop in core temperature leads to decreasing metabolic rate. If the core temperature does not meet any of the criteria for increases/decreases, the metabolic rate will be calculated as the basal metabolic rate.
Calculate Sweat Rate
The sweat rate is calculated from a core temperature control function. The mass lost due to sweating is accounted for, and a flow source from the skin extravascular to ground path is updated to ensure fluid loss.
Update Heat Resistance
The variable core to skin heat transfer resistance is updated according to the inverse of the skin blood flow.
Exercise
The exercise function adds to the body’s basal metabolic rate a value that is specified by the exercise action. The metabolic rate set-point is specified by the action but limited by the amount of energy available. The energy limit is computed, and the actual metabolic rate is ramped to the limited set-point. The body's actual work rate as a fraction of the total possible work rate and the body's actual work rate as a fraction of the action-requested work rate are set in this method.
Process
Process Temperature Circuit
The generic circuit methodology developed for the engine is used to solve for the temperature and heat transfer rate at each node or path. For more details, see Circuit Methodology.
Calculate Vital Signs
The core and skin temperatures are recorded in this function. In addition, the current metabolic state of the patient may trigger the following events: hypothermia, hyperthermia, dehydration, fasciculation, or fatigue. These events are only triggered if the current state falls within the criteria of the specific event.
Postprocess
The Postprocess step moves everything calculated in Process from the next timestep calculation to the current timestep calculation. This allows all other systems access to the information when completing their preprocess analysis for the next timestep.
Features, Capabilities, and Dependencies
The Energy system is connected with every other system. Energy directly affects the Cardiovascular System through modification of vascular tone, heart rate, and heart contractility. This leads to modifications in the cardiac output and flow distribution in the cardiovascular circuit. In addition, there is indirect feedback through the modification of oxygen consumption and carbon dioxide production. Increased carbon dioxide production can lead to higher arterial carbon dioxide, which, in the case of severe hypercapnia, causes an Endocrine response in the form of epinephrine and norepinephrine release. There is direct feedback on the Respiratory system via modification of the ventilation frequency and driver pressure. The previously mentioned oxygen consumption and carbon dioxide production changes indirectly based on feedback to Respiratory driver, which is dependent on the arterial carbon dioxide and arterial oxygen. There is a dependence on the Gastrointestinal and Renal systems since they are the methods by which nutrients enter the body and metabolic wastes are cleared from the body.
The Environment circuit is directly connected to the energy’s internal temperature circuit to form the total temperature circuit. Modifications on the metabolic rate will therefore have a direct feedback on the environment temperature circuit, while changes in the ambient environment temperature will have a direct feedback on the metabolic rate.
Additional dependence on the cardiovascular system comes from the extravascular to vascular connection. The cardiovascular circuit is connected to the extravascular circuit via singular paths from the tissue-equivalent vascular node to the tissue node. These singular paths are formed by a flow resistance and contain a compliance which stores the extravascular volume.
Patient Variability
The basal metabolic rate is computed from the sex, height, weight, and age of the patient using the Harris-Benedict formula and will be directly affected by patient variability. Other indirect effects, such as fluid compositional changes due to sweating, may be observed. As with all of the systems, the energy system is validated using the Standard patient. A detailed discussion of patient variability is available in the Patient Methodology report.
Assumptions and Limitations
The Energy system assumes a bulk representation of all of its metabolic substances to avoid tracking all possible biochemical reactants and products. It assumes that all carbohydrates are stored in the tissue as glucose. Glycogen stores are not considered since the bulk representation of carbohydrates is glucose. A similar assumption is made for lipids. The bulk representation of all lipids is tristearin. It is not converted into its fatty acid constituents in the blood stream. This assumption is carried through to ketones. All ketones are assumed to be acetoacetate. It is assumed that all of these substances move with the flow into and out of the extravascular space.
Actions
Exercise
The exercise action is initiated by specifying the exercise intensity. The exercise intensity is a number between 0 and 1 that defines the requested fraction of the body's maximal work rate. For instance, the average adult male has a maximal work rate of approximately 1200 Watts [156]; therefore, a user-specified exercise intensity of 0.5 would request a work rate of 600 Watts from the body. Table 1 shows the approximate exercise intensity for some common activities executed by an average adult male. The approximate mechanical power produced by an adult male is also included in the table.
| Activity | Exerise Intensity | Mechanical Power (W) |
|---|---|---|
| All muscles in the body working all-out [156] | 1.0 | 1200 |
| All-out cycling with resistance, sustainable for approx. 8 seconds [34] | 0.8 | 1000 |
| Rowing 6.1 m/s on an ergometer [67] | 0.54 | 650 |
| Running at about 7.1 m/s (16 mph) [181] | 0.36 | 430 |
| 'Typical' Level Cycling [167] | 0.1 | 120 |
| Jogging at about 2.2 m/s (5 mph) [181] | 0.06 | 70 |
| Rest | 0.0 | 0 |
The exercise capacity of the body is physiologically and psychologically limited [265]. The amount of work produced by the exercise action is limited by the fatigue model; however, this limitation is purely physiologic. Fatigue is modeled as a system of interconnected energy storage compartments, as shown in Figure 3.
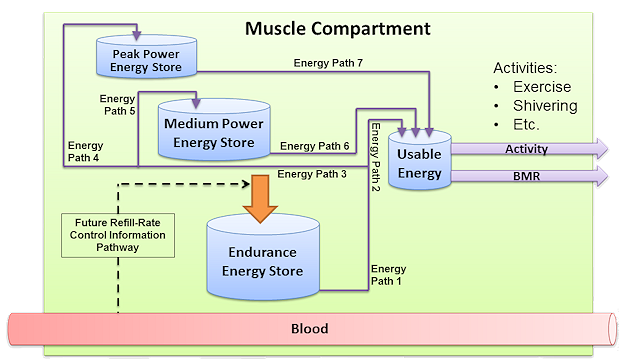 Figure 3 The fatigue compartment model. The energy stores are represented by the blue buckets. The solid lines show the energy flow pathways, and flow directions are indicated by the arrowheads. The dashed line is a future information pathway to control the endurance energy store fill rate. The amount of energy in each store is computed using equations 7 and 8. The energy flow rates through each path, labeled Energy Path 1 through 7 in the figure, are computed using equations 9 to 18. The refill rate of the endurance energy store is computed using equation 19. The outflow of energy from the usable energy store is only non-zero when the activity level of the body is above zero, and it is computed directly from the total work rate.
The energy available for work is found/stored in the usable energy compartment. There are two anaerobic compartments and one aerobic compartment that replenish the usable energy compartment. The peak power compartment is analogous to the phosphagen system, the medium power compartment is analogous to the glygogen-lactic acid system, and the endurance compartment can be though of as the aerobic energy system. The amount of energy in each compartment is calculated by adding the change in energy to the current energy level at each timestep, as shown in Equation 6, where E is the level of energy in the store. The compartment energy levels are bounded between zero and the maximum capacity.
![\[E(t + \Delta t) = E(t) + \frac{dE}{dt} \Delta t \]](form_38.png)
The change in energy is computed by summing the energy flow rates, as shown in Equation 7, where *FE,in* and *FE,out* are the energy flow through the paths leading into and out of the stores, respectively.
![\[ \frac{dE}{dt} = \Sigma \left(F_{E,in} \right) - \Sigma \left(F_{E,out} \right) \]](form_39.png)
With the exception of the usable energy store, all of the outflow rates are proportional to the energy deficit in the downstream compartment. The usable compartment outflow rate is the work rate. The peak and medium power compartment inflow rates are determined by two split factors. The first split factor determines the amount of endurance energy that is being directed to usable energy, and the second determines how much of the remaining energy goes to filling the peak and medium stores. The split factors are computed from the deficits in the energy compartments. In other words, all energy replenishment is based on the current needs. The energy flow rate governing equations are shown in Equation 8 to Equation 17, where *Fi* is the energy flow rate through energy path i, S is a split fraction between 0 and 1, *Nstore* is the deficit in a store normalized to the maximum level in that store, and *Mstore* is a piecewise linear map for the store deficit normalizations. The purpose of the piecewise function is to allow purely aerobic energy use at low exercise rates. The energy paths are labeled in Figure 3, and the direction of energy flow is indicated by the arrows. The rates are bound at the upper limit by a proportion of the maximum work rate where the maximum work rate is 1 times the maximum endurance rate plus 2.5 times the maximum endurance rate (the maximum medium power rate) plus 4 times the maximum endurance rate (the maximum peak power rate). These limits are chosen to mimic the maximum aerobic, glycogen-lactic acid, and phosphogen to ATP conversion rates [156]. Rates are bound at the lower limit by zero.
![\[ F_{1} = \left(N_{Usable} + N_{Peak} + N_{Medium} \right) F_{1,max} \]](form_40.png)
![\[ F_{2} = S_{1} F_{1} \]](form_41.png)
![\[ F_{3} = (1-S_{1}) F_{1} \]](form_42.png)
![\[ S_{1} = \frac{N_{Usable}}{N_{Usable} + 0.5 * \left(N_{Medium} + N_{Peak} \right)} \]](form_43.png)
![\[ F_{4} = S_{2} F_{3} \]](form_44.png)
![\[ F_{5} = (1-S_{2}) F_{3} \]](form_45.png)
![\[ S_{2} = \frac{N_{Peak}}{N_{Peak} + N_{Medium}} \]](form_46.png)
![\[ F_{6} = M_{Usable} N_{Usable} F_{6,max} \]](form_47.png)
![\[ F_{7} = M_{Usable} N_{Usable} F_{7,max} \]](form_48.png)
![\[ M_{Usable} = \left\{ \begin{array}{ll} N_{Usable} \leq 0.8333 & 0 \\ N_{Usable} > 0.8333 & 6*N_{Usable} - 5 \\ \end{array} \right. \]](form_49.png)
The energy flow rate into the endurance energy store, indicated by the large orange arrow in Figure 3, is independent of bloodborne substances in the current release; however, this rate will be coupled to the nutrient substance concentrations in the blood in a future release. Equation 18 shows the endurance fill rate, where *kendurance* is a constant and *NTotal* is the sum of the normalized store deficits.
![\[ F_{Endurance} = k_{Endurance} * N_{Total} \]](form_50.png)
There are three output parameters associated with the exercise action: the achieved exercise level, the fatigue level, and the total work rate level.
- Achieved exercise level: This is the fraction of requested work that the body is able to achieve. For instance, if a work rate of 300 Watts is requested and the body is able to deliver 300 Watts, then the achieved exercise level will be 1.0. After some time, the body's energy levels will be depleted, and it will only be able to produce a fraction of the requested work rate, so the achieved exercise level will be less than 1.0.
- Fatigue level: This is the exhaustion level of the body. A fatigue level of 1.0 indicates that the body has no energy available to do work. At low work rates the fatigue level increases slowly, and the rate of fatigue increase is related to type of metabolism producing the energy (i.e. aerobic or anaerobic).
- Total work rate level: This is the fraction of the full work rate capacity of the body at which the body is currently working. For example, if the rested body is capable of producing a maximum of 1200 Watts of power for some amount of time, then that body working a rate of 600 Watts would have a work rate level of 0.5. This output is similar to the exercise intensity input.
Conditions
Dehydration
Even minimal levels of dehydration, such as a loss of less than 2% body weight, can elicit thermoregulatory responses that impair exercise capacity [254]. These responses include diminished peripheral circulation due to vasoconstriction in the skin, compensating for concentrated blood flow in core organs. Additionally, there is a reduction in sweating and impaired evaporative heat loss mechanisms, leading to an increased core temperature. To model these responses, we apply the thermoregulatory consequences of dehydration as if they progressed slowly and came to a new homeostasis. This involves adding a single bolus of heat to the core using the metabolic heat source in the internal temperature circuit. This stores heat in the core node, elevating its temperature. The model also incorporates reduced peripheral circulation due to vasoconstricted skin by increasing the core-to-skin resistance. Concurrently, a modifier reduces the sweat rate and thus the evaporative heat loss.
For further details on the application and validation of the dehydration model, refer to the TissueSystem and NervousSystem documentation.
Starvation
The starvation condition is disabled in the current release. An improved starvation condition is coming soon. The starvation functionality simulates an extended time period without nutrient intake. This is accomplished by assuming a coarse timestep over which numerous mechanisms lead to the decay of nutrients in the body. With regards to the Energy system, metabolic consumption calculations are carried out over the interval of the coarse timestep. This leads to a large decrement of vital nutrients in the tissues and increment of waste by-products at the beginning of condition stabilization. Other systems handle starvation in a similar manner. Renal and systemic clearance volumes are calculated over the coarse timestep, and the resulting decrement in substances is distributed based on volume across all vascular and tissue compartments. For more information on renal and systemic clearance, see Renal Methodology and Drugs Methodology.
Events
Hypothermia
Hypothermia is defined as a decrease in core temperature below 35 degrees Celsius [232]. In the engine, this is triggered due to changes in the external environment, leading to increased heat transfer off the skin surface.
Hyperthermia
Hyperthermia is defined as an increase in core temperature above 38.8 degrees Celsius [232] . This may result from vigorous exercise, harsh environments, or infection. In the engine, this event is achievable through the exercise action or by specifying a high-temperature environment.
Dehydration
Dehydration is classified by the World Health Organization as a three percent decrease in patient body mass due to fluid loss [399]. This is tested by summing the total fluid mass on the cardiovascular and extravascular circuits at each timestep. Currently, this event can be triggered during a hemorrhage action or through prolonged exercise.
Fatigue
The fatigue event is triggered by any depletion of the energy stores, and it is removed when the energy stores are at capacity. Note that fatigue is only triggered by above-basal metabolic energy production. A fatigue event indicates that the skeletal muscle of the body has been active.
Fasciculation
Fasciculation is involuntary twitching of the skeletal muscle. This can be caused from a variety of conditions, such as mineral deficiency or stimulant use. In the engine, the criteria for the fasciculation event is calcium deficiency. If the patient’s arterial calcium concentration falls below one milligram per deciliter, then fasciculation is triggered [146].
Results and Conclusions
Validation - Resting Physiologic State
Standard Male
| Property Name | Expected Value | Engine Value | Percent Error | Notes |
|---|---|---|---|---|
| CoreTemperature(degC) | 37.0 [167] | Mean of 37.1 | 0.166% | |
| CreatinineProductionRate(umol/s) | 0.176 [112] | Mean of 0.177 | 0.568% | |
| KetoneProductionRate(umol/min) | 308.0 [100] | Mean of 300.0 | 2.60% | |
| LactateProductionRate(mol/day) | 1.3 [288] | Mean of 1.3 | 5.50e-06% | |
| SkinTemperature(degC) | 33.0 [167] | Mean of 32.9 | 0.324% | |
| SweatRate(mg/min) | 347.0 [237] | Mean of 332.0 | 4.32% | Converted from 500 mL/day assuming a density of 1,000 kg/m3 |
| TotalMetabolicRate(kcal/day) | [1200, 3000] [266] | Mean of 1737 | 0.00% | 1790 roza1984metabolic for 77 kg man |
Standard Female
| Property Name | Expected Value | Engine Value | Percent Error | Notes |
|---|---|---|---|---|
| CoreTemperature(degC) | 37.0 [167] | Mean of 37.0 | 0.00% | |
| CreatinineProductionRate(umol/s) | 0.176 [112] | Mean of 0.177 | 0.568% | |
| KetoneProductionRate(umol/min) | 308.0 [100] | Mean of 300.0 | 2.60% | |
| LactateProductionRate(mol/day) | 1.3 [288] | Mean of 1.3 | 5.50e-06% | |
| SkinTemperature(degC) | 33.0 [167] | Mean of 32.7 | 0.786% | |
| SweatRate(mg/min) | 347.0 [237] | Mean of 335.1 | 3.43% | Converted from 500 mL/day assuming a density of 1,000 kg/m3 |
| TotalMetabolicRate(kcal/day) | [1200, 3000] [266] | Mean of 1306 | 0.00% | 1790 roza1984metabolic for 77 kg man |
The resting system properties for the energy system are temperatures and metabolic production rates. From Table 2, it is shown that the temperatures meet the validation criteria extremely well for resting conditions. The production rates show reasonable agreement with the validation data. Gas consumption and production yield the largest disparity. This is due to accurate resting physiology being achieved for the displayed consumption and production rates. Additional refinement of the gas consumption and production rates can occur, but the change would propagate through the other systems. In order to preserve accurate resting physiology all other systems would need to be adjusted for this change. This is currently planned for a future release. The remaining metabolic production rates show good agreement with the validation data.
Validation - Actions and Conditions
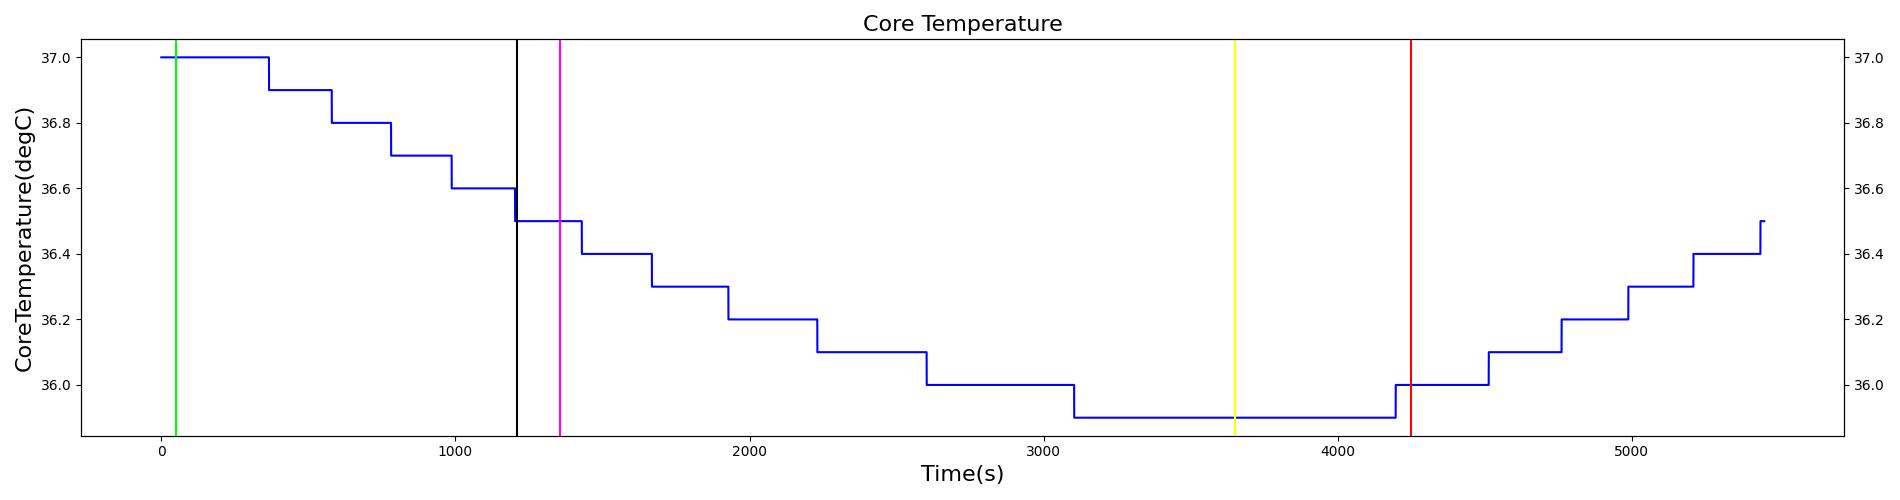
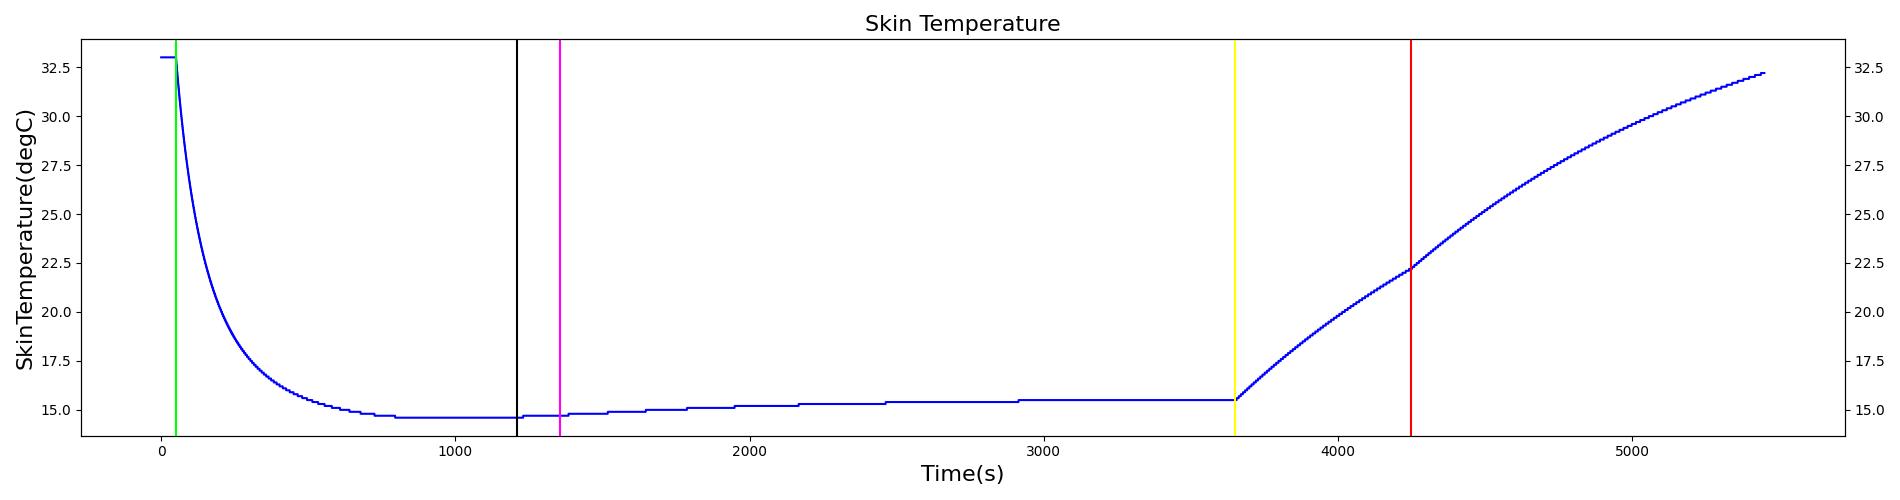
The Energy and Environment systems were validated for four scenarios encompassing four different actions. These include: exercise, cold water submersion (including active heating), and a high altitude environment change. These scenarios were meant to test the dynamic feedback of the energy environment systems on both thermal regulation and internal physiology. There is good agreement with the expected results.
| Scenario | Description | Good | Decent | Bad |
|---|---|---|---|---|
| ColdWaterSubmersion | Patient is submerged in 10 C water for 1 hour. Removed for 10 minutes, and then actively heated for 20 minutes | 11 | 12 | 1 |
| HighAltitude | Patient enters 4000 m elevation environment for 15 minutes | 1 | 0 | 5 |
| ExerciseStages | Exercise for six minutes at increasing intensity with 2 minutes of rest in between stages. | 76 | 3 | 33 |
| ExerciseVO2max | Exercise at high intensity (430 watts) to exhaustion. | 1 | 0 | 0 |
| Total | 89 | 15 | 39 |
Exercise
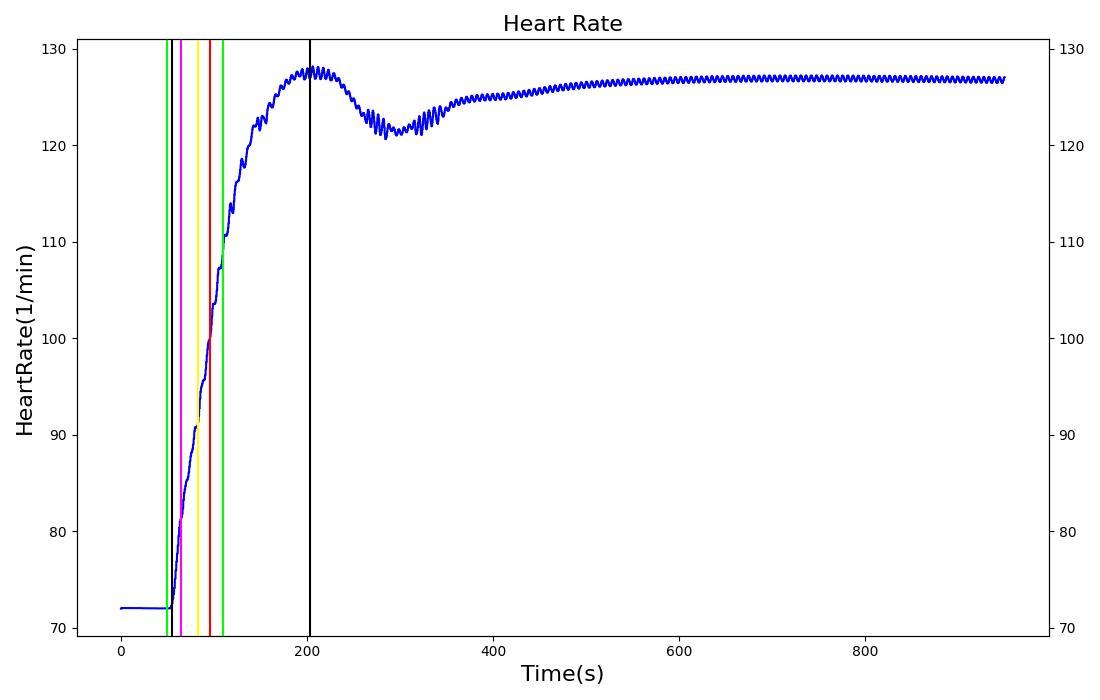
There are two scenarios for validation of the exercise action. The first scenario qualitatively validates that a work rate threshold exists. The scenario is based on the assertion by [181] that a body working around the threshold for maximal oxygen uptake (approximately 430 watts) will only be able to perform at the desired level for about three minutes before reaching physiological limits. The second scenario takes advantage of the abundance of experiments using variations of the Bruce protocol to study exercise physiology. In the second scenario, the exercise intensity is periodically increased, with short breaks in between each exercise period. The quantitative validation results are shown in the table below.
Table 4 The dynamic response to exercise. 15 measures are compared to data reported in literature at 8 different times during increasing exercise intensity with intermittent rest, for a total of 120 points of comparison. Of those, 86 were within 10 percent of the reported value, 8 were within 30 percent, and 26 deviated from the expected value by more than 30 percent. The first intensity/rest period is shown in this table.
| Segment | Notes | Occurrence Time (s) | Sampled Scenario Time (s) | Core Temperature (Celsius) | Peripheral Temperature (Celsius) | Heart Rate (beats/min) | Systolic Pressure (mmHg) | Diastolic Pressure (mmHg) | Mean Arterial Pressure (mmHg) | Stroke Volume (mL) | Cardiac Output (L/min) | Gut Blood Flow (L/min) | Systemic Vascular Resistance (mmHg-min/L) | Respiration Rate (breaths/min) | Tidal Volume (L) | Respiratory Exchange Ratio | Oxygen Consumption (L/min) | Urine Production Rate (mL/min) |
|---|---|---|---|---|---|---|---|---|---|---|---|---|---|---|---|---|---|---|
| Exercise Severity 0.0375 | 45 watts | 30 | 389 | Increase [101], [49] | No change or decrease [103] | 156% of baseline [101] | Increase 18.4% [101] | No change [101] | 1% increase [101] | 41.6% increase [101] | 225% of base [101] | reduced [105] | decrease [105] | Increase [109] | increase [109] | increase, maximum ~1.21 [206] | 1.33 [101] | decrease [244] |
| Exercise Severity 0 | rest 2 minutes | 390 | 509 | Increase [101] or no change [49] | No change or decrease [103] | Decreasing [Sensus Communis] | Toward baseline [101] | No change [101] | Toward baseline [101] | Toward baseline [101] | Toward baseline [101] | Toward baseline [101] | Toward baseline [101] | Toward baseline [101] | Toward baseline [101] | No Data | Toward baseline [101] | No Data |
| Segment | Notes | Occurrence Time (s) | Sampled Scenario Time (s) | Core Temperature (Celsius) | Peripheral Temperature (Celsius) | Heart Rate (beats/min) | Systolic Pressure (mmHg) | Diastolic Pressure (mmHg) | Mean Arterial Pressure (mmHg) | Stroke Volume (mL) | Cardiac Output (L/min) | Gut Blood Flow (L/min) | Systemic Vascular Resistance (mmHg-min/L) | Respiration Rate (breaths/min) | Tidal Volume (L) | Exchange Ratio (Or Respiratory Quotient) | Oxygen Consumption (L/min) | Urine Production Rate (mL/min) |
|---|---|---|---|---|---|---|---|---|---|---|---|---|---|---|---|---|---|---|
| Exercise Severity 0.075 | 90 watts | 510 | 869 | Increase [101], [49] | No change or decrease [103] | 197% of baseline [101] | 34.4% increase [101] | No change [101] | 8.38% increase [101] | 29.9% increase [101] | 267% of base [101] | reduced [105] | decrease [105] | Increase [109] | increase [109] | increase, maximum ~1.21 [206] | 2.05 [101] | decrease [244] |
| Exercise Severity 0 | rest 2 minutes | 870 | 989 | Increase [101] or no change [49] | No change or decrease [103] | Decreasing [Sensus Communis] | Toward baseline [101] | No change [101] | Toward baseline [101] | Toward baseline [101] | Toward baseline [101] | Toward baseline [101] | Toward baseline [101] | Toward baseline [101] | Toward baseline [101] | No Data | Toward baseline [101] | No Data |
| Segment | Notes | Occurrence Time (s) | Sampled Scenario Time (s) | Core Temperature (Celsius) | Peripheral Temperature (Celsius) | Heart Rate (beats/min) | Systolic Pressure (mmHg) | Diastolic Pressure (mmHg) | Mean Arterial Pressure (mmHg) | Stroke Volume (mL) | Cardiac Output (L/min) | Gut Blood Flow (L/min) | Systemic Vascular Resistance (mmHg-min/L) | Respiration Rate (breaths/min) | Tidal Volume (L) | Exchange Ratio (Or Respiratory Quotient) | Oxygen Consumption (L/min) | Urine Production Rate (mL/min) |
|---|---|---|---|---|---|---|---|---|---|---|---|---|---|---|---|---|---|---|
| Exercise Severity 0.1583 | 190 W | 990 | 1349 | Increase [101], [49] | No change or decrease [103] | 237% of baseline [101] | 46.4% increase [101] | No change [101] | 14.1% increase [101] | 36.4% increase [101] | 336% of base [101] | reduced 25-50% [105] | decrease [105] | Increase [109] | increase [109] | increase, maximum ~1.21 [206] | 2.75 [101] | decrease [244] |
| Exercise Severity 0 | rest 2 minutes | 1350 | 1469 | Increase [101] or no change [49] | No change or decrease [103] | Decreasing [Sensus Communis] | Toward baseline [101] | No change [101] | Toward baseline [101] | Toward baseline [101] | Toward baseline [101] | Toward baseline [101] | Toward baseline [101] | Toward baseline [101] | Toward baseline [101] | No Data | Toward baseline [101] | No Data |
| Segment | Notes | Occurrence Time (s) | Sampled Scenario Time (s) | Core Temperature (Celsius) | Peripheral Temperature (Celsius) | Heart Rate (beats/min) | Systolic Pressure (mmHg) | Diastolic Pressure (mmHg) | Mean Arterial Pressure (mmHg) | Stroke Volume (mL) | Cardiac Output (L/min) | Gut Blood Flow (L/min) | Systemic Vascular Resistance (mmHg-min/L) | Respiration Rate (breaths/min) | Tidal Volume (L) | Exchange Ratio (Or Respiratory Quotient) | Oxygen Consumption (L/min) | Urine Production Rate (mL/min) |
|---|---|---|---|---|---|---|---|---|---|---|---|---|---|---|---|---|---|---|
| Exercise Severity 0.3583 | 430 W | 1470 | 1829 | Increase [101], [49] | No change or decrease [103] | 257% of baseline [101] | 56.8% increase [101] | No change [101] | 117.9% increase [101] | 31.2% increase [101] | 350% of base [101] | reduced 25-50% [105] | decrease [105] | 59 +/- 9 [109] | 3.1 +/- 0.4 [109] | increase, maximum ~1.21 [206] | 3.36 [101] | decrease [244] |
| Exercise Severity 0 | rest 2 minutes | 1830 | 1950 | Increase [101] or no change [49] | No change or decrease [103] | Decreasing [Sensus Communis] | Toward baseline [101] | No change [101] | Toward baseline [101] | Toward baseline [101] | Toward baseline [101] | Toward baseline [101] | Toward baseline [101] | Toward baseline [101] | Toward baseline [101] | No Data | Toward baseline [101] | No Data |
| Segment | Notes | Occurrence Time (s) | Duration of Full Exercise |
|---|---|---|---|
| Exercise Severity 0.3583 | Exercise intensity of 0.3583 is a requested work rate of 430 watts. | N/A | ~ 3 min [181] |
There are several physiological measures that are failing validation for the exercise action. However, most of the failing measures will be addressed by the chemoreceptor model currently in development as a part of the nervous system. The oxygen consumption and urine production measures may still fail validation during exercise after the nervous system is fully implemented. The development team is currently making plans to address those failures.
Cold Water Submersion
| Action | Notes | Occurrence Time (s) | Sampled Scenario Time (s) | Core Temperature (Celsius) | Peripheral Temperature (Celsius) | Metabolic Rate | Heart Rate (beats/min) | Systolic Pressure (mmHg) | Diastolic Pressure (mmHg) | Mean Arterial Pressure (mmHg) | Cardiac Output (L/min) |
|---|---|---|---|---|---|---|---|---|---|---|---|
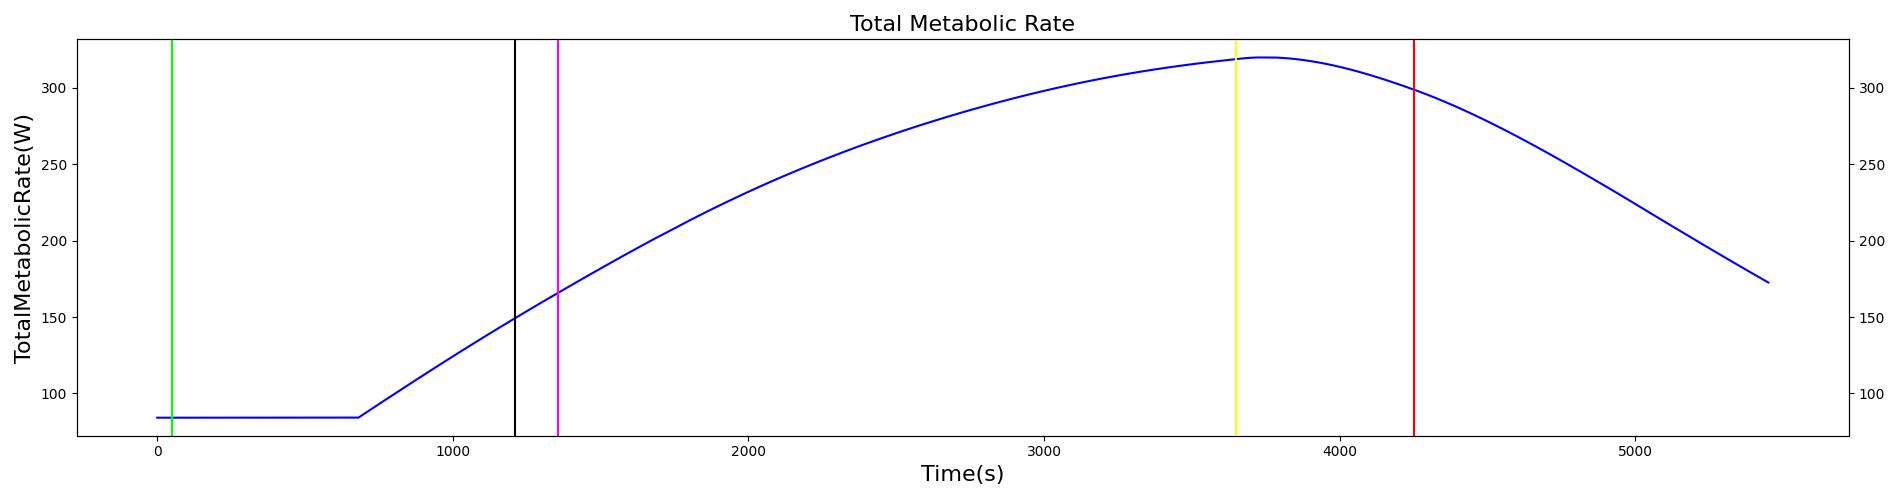
| Environment File Change: Submerged in 5 C water | Patient is submerged in cold for 60 minutes | 50 | 3650 | Decrease to 35 degC [403] | Decrease [Sensus Communis] | Increase to between 300 and 350 W [403] | Decrease [131] | No change [101] | If mild hypothermia (Core Temp 32-35 C) Increase [232] | If mild hypothermia (Core Temp 32-35 C) Increase [232] | If mild hypothermia (Core Temp 32-35 C) Increase If moderate or severe (Core Temp < 32 C) Decrease [232] |
| Environment File Change to Standard Environment | 3650 | 4250 | Decrease below 35 [403] | Increase [Sensus Communis] | Increase above 350 W [403] | Decrease [108] | Decrease [108] | Decrease [108] | Decrease [108] | Decrease [108] | |
| Active Heating at 1000 btu/hr | 480 | 5450 | Increase to between 36 and 38 degC [403] | Increase [Sensus Communis] | Decreasing to below 80 W [403] | Decrease [108] | Decrease[108] | Decrease [108] | Decrease [108] | Decrease [108] |
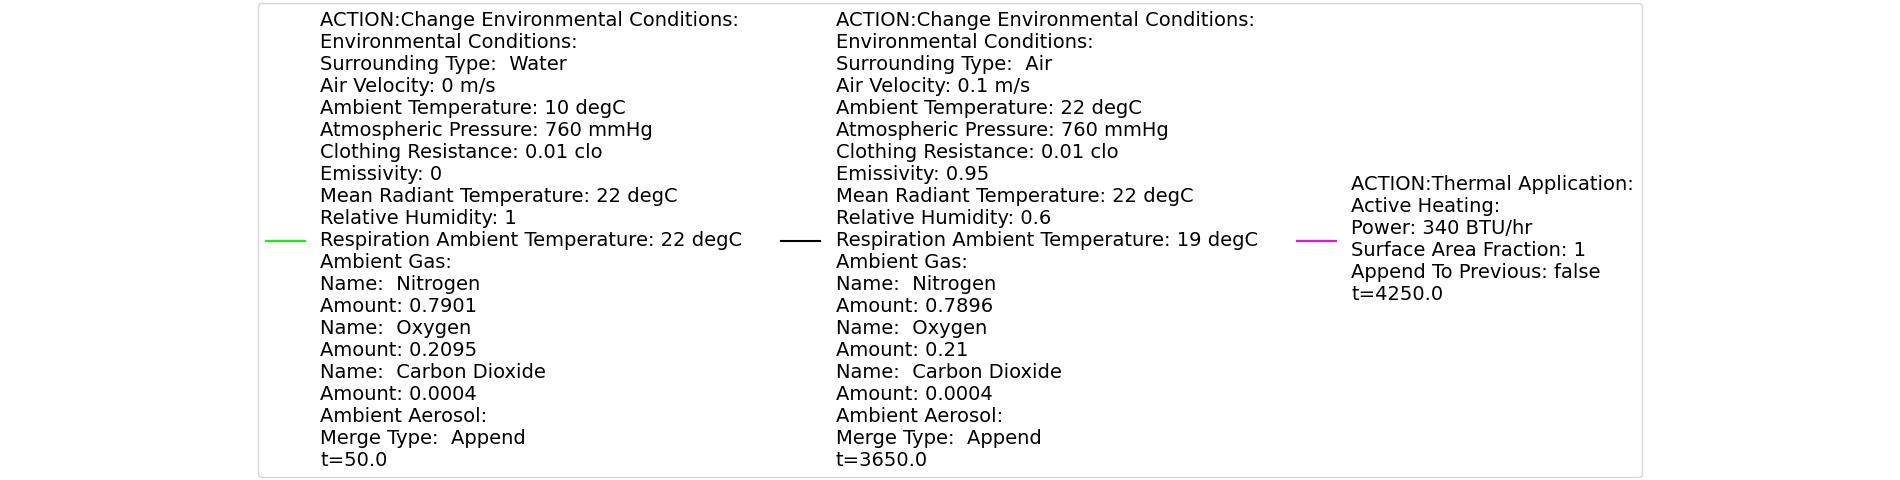
At a scenario time of 50 seconds, the patient is submerged in water with a temperature of 10 degrees Celsius. The patient remains submerged for one hour, and then is removed from the water. The patient remains in the ambient environment for 10 minutes before active heating is applied. The power output of the heating device is 340 btu/hr. Active heating continues for 20 minutes, and then the scenario ends. The immediate response to cold water submersion is a drop in skin temperature. This occurs due to a dramatic increase in the skin convective heat transfer due to a shift from air convection to water convection. The core temperature declines due to increased heat transfer from core to skin. The drop in core temperature initiates a shivering response, leading to a rise in metabolic rate. Additional feedback comes in the form of vasoconstriction of the skin blood vessels. This helps to reduce the heat transferred from the core to skin. These two forms of feedback allow the core temperature to stabilize around 35 degrees Celsius. There is an increase in heart rate and respiration rate, initially due to a nervous response to the exposure to cold water. The increase in respiration rate and heart rate are maintained to accommodate the increased oxygen consumption and carbon dioxide production at the elevated metabolic rate. Following the return to the ambient environment, there is an immediate rise in skin temperature, with the core temperature following. The core temperature rise is not expected during this time period according to validation data. A continued decline in core temperature is expected. The observed increase in core temperature is due to a low heat capacitance used in the model and not accounting for residual water remaining on the skin surface after being removed from the water. The capacitance can be adjusted to a higher value, which would lead to the core temperature responding more slowly to changes in heat transfer over time. In addition, the Environment heat transfer methodology could be updated to account for additional heat transfer due to water remaining on the skin surface after exiting submersion. At the onset of active heating, the skin temperature and core temperature continue to rise. This coincides with the expected validation outcome.
High Altitude Change
 | 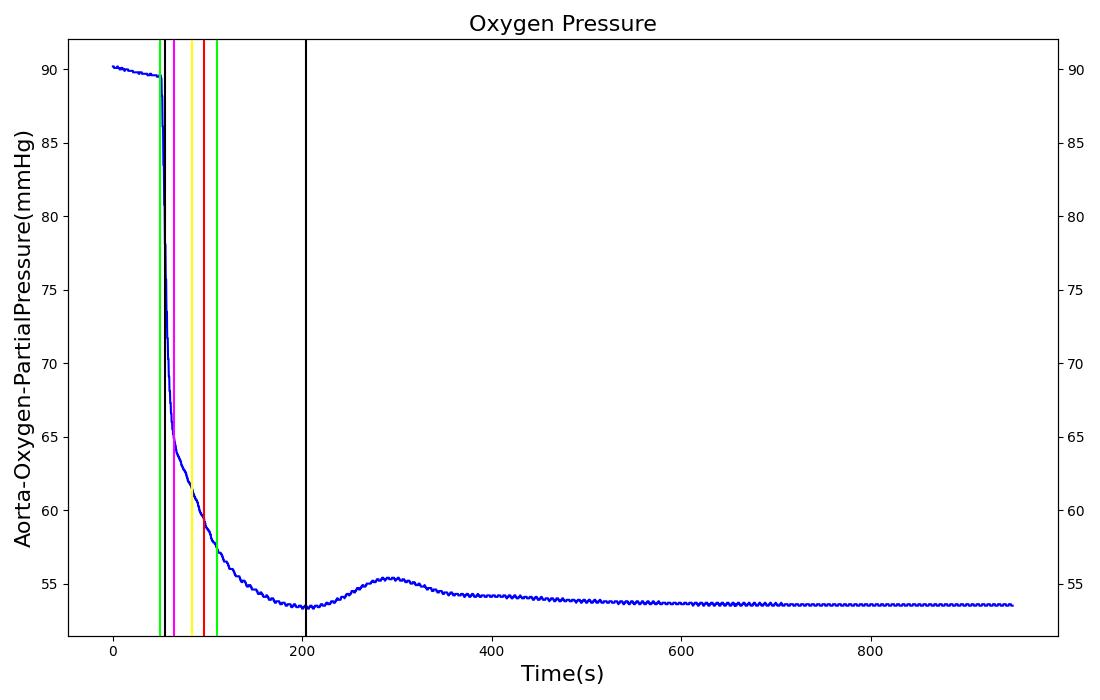 |
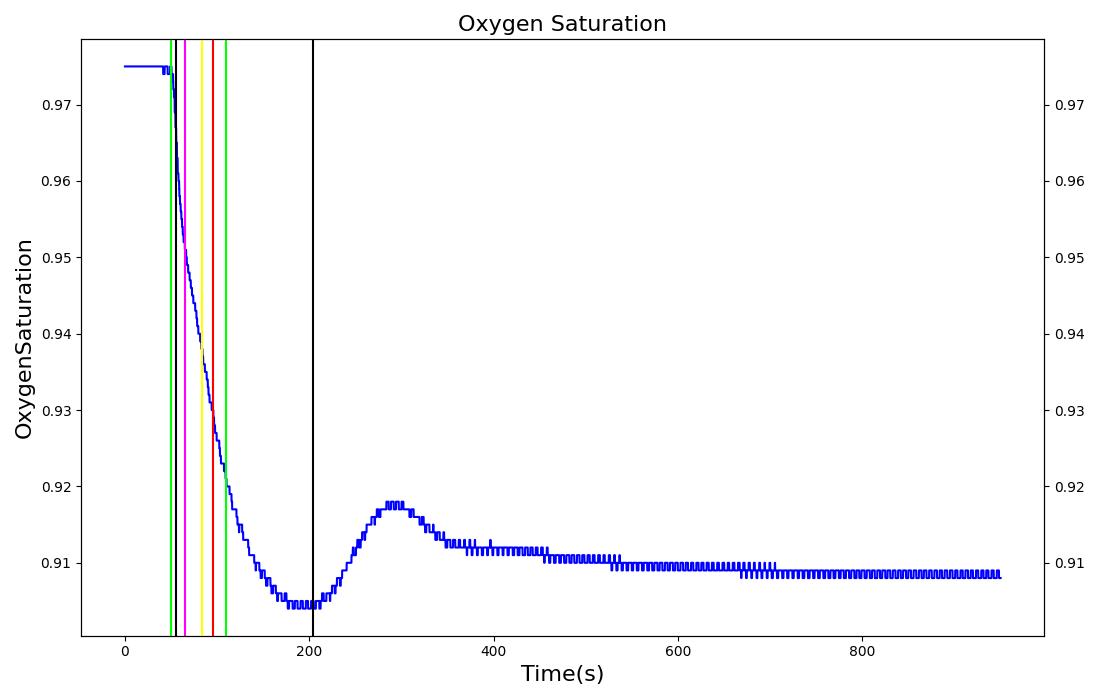 | 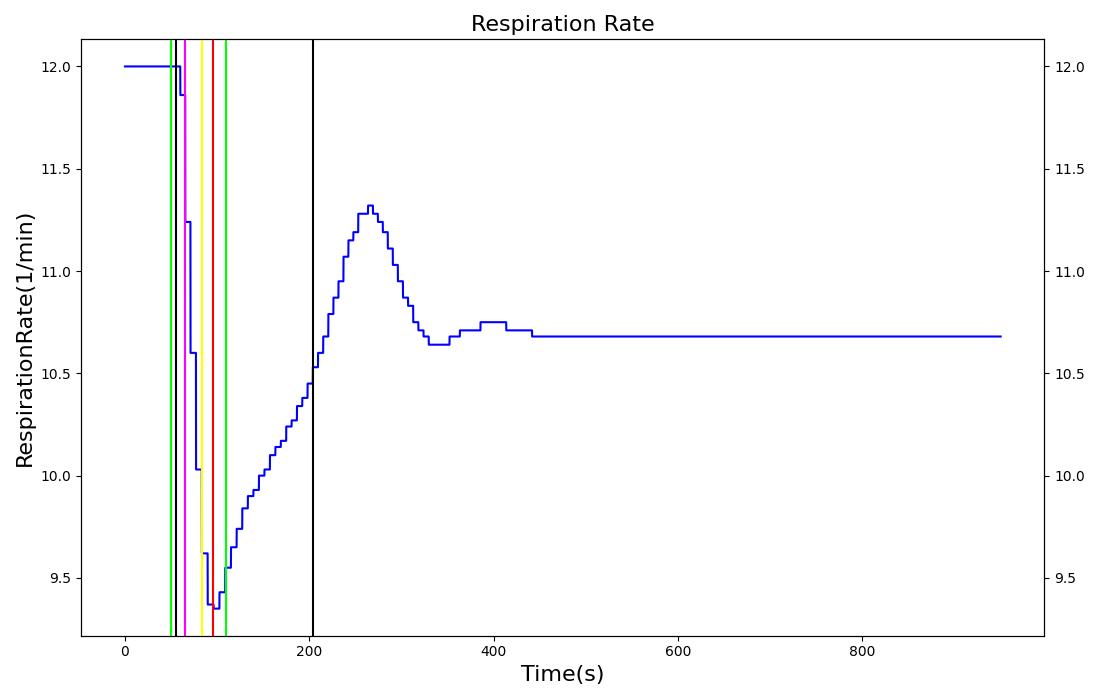 |
 | |
This scenario is used to simulate the effects of low oxygen due to high altitude. At 30 seconds, the surrounding environment is changed to an equivalent elevation of 4000 meters, resulting in a drop in atmospheric pressure from 760 mmHg to 525 mmHg. The patient remains in the reduced pressure environment for 15 minutes. The immediate response is a decrease in arterial oxygen due to the reduced partial pressure in the environment. This leads to a decrease in the blood oxygen saturation, which is in line with the expected validation data. The reduced arterial oxygen causes an increase in the heart rate. This increase is currently determined from epinephrine release due to a hypoxia event being triggered. Another expected result of the epinephrine release is a respiration rate increase. This effect is nullified from the reduction in atmospheric carbon dioxide, which allows for larger quantities of carbon dioxide to diffuse out of the alveoli. The increased diffusion leads to lower arterial carbon dioxide partial pressures, which is used to drive the respiratory frequency. This counter balances the effect of epinephrine in the system, thus causing a slight decrease in respiration rate.
Starvation and Dehydration
The starvation and dehydration conditions are currently disabled while we make improvements.
Conclusions
The Energy system has provided a method for handling metabolic consumption and production and heat transfer in the human body. This system is fundamentally connected to all of the other systems, and provides dynamic feedback according to changes in the external environment. In its current state, the energy system accurately calculates resting thermal physiology and nutrient consumption and production. The energy system can be used by developers who wish to model thermal changes due to the environment or through strenuous activity. This may be a simple simulation, or connection with a mannequin for real-time interfacing.
Future Work
Coming Soon
- The starvation condition will be integrated into exercise and the fatigue calculations, and replenishment of the aerobic energy store will be coupled to blood concentrations of nutrient substances.
- The fatigue model energy store maximums and maximum refill rates will scale with physical conditioning, fed/starvation levels, and body composition.
- The maximum work rate will scale with physical conditioning, fed/starvation levels, and body composition.
- The fatigue model endurance energy store refill rate will be coupled to blood nutrient substance concentrations.
- The nervous system will contain numerous chemoreceptor-related feedback mechanisms that will correct many of the exercise validation failures such as heart rate and blood pressure.
- The response of body core temperature to exercise will be improved.
Recommended Improvements
- Increased discretization of the temperature circuit: This would allow for increased fidelity of the temperature solution and prediction of varying levels of water submersion.
- Full biochemical model of metabolism: The current implementation of the metabolic calculations is a low fidelity approach. Increased fidelity could be used to provide more feedback on nutrient requirements and performance.
- Include psychological effects. For example, incorporate psychology into fatigue using a 'mettle' parameter.
- Switch exercise accounting from physical work rate to metabolic heat production.
- A true basal metabolic rate with differentiation from resting metabolic rate.
Appendices
Glossary
RQ - Respiratory Quotient BMR - Basal Metabolic Rate
Data Model Implementation
Compartments
- InternalCore
- InternalSkin
- InternalGround