Dehydration-Mild
Mild Dehydration
Description
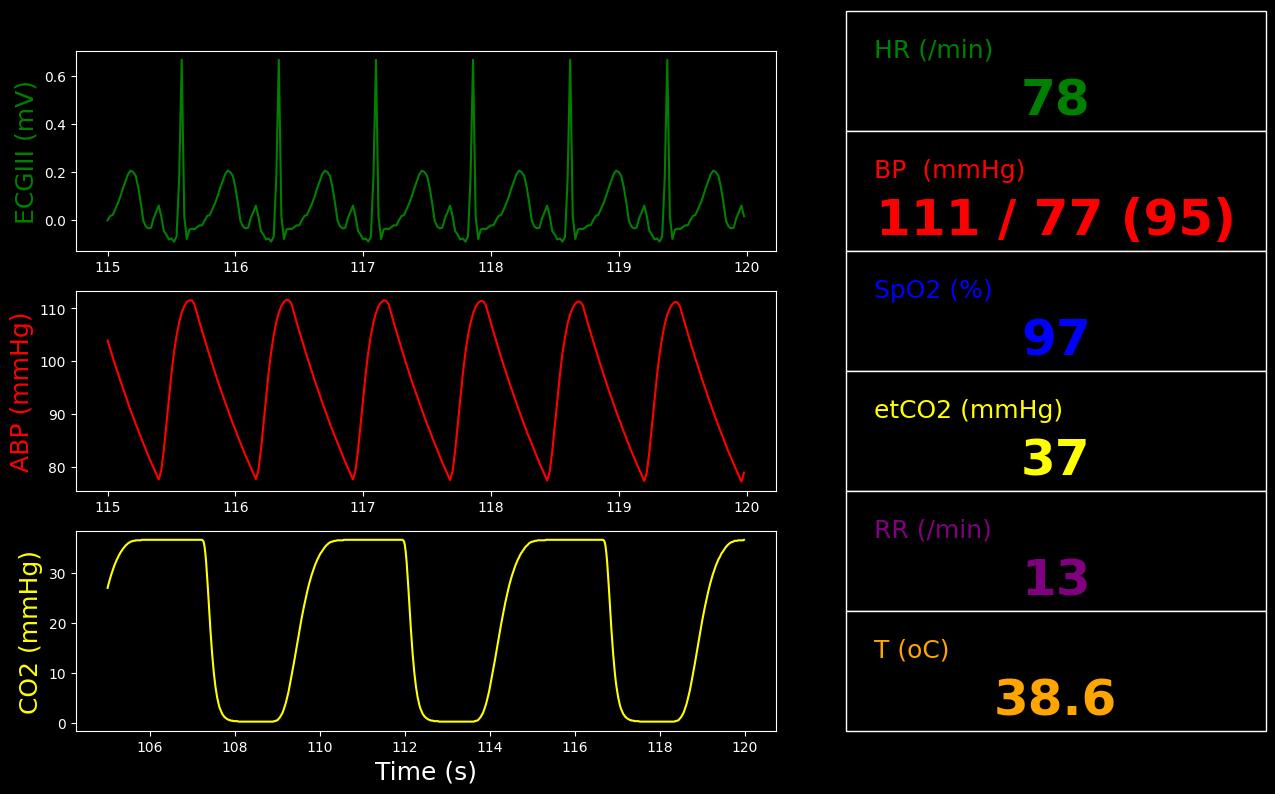
Mildly dehydrated patient from excessive sweating.
Segment Validation
Segment 1
| Property Name | Validation | Engine Value | Percent Error | Percent Change | Notes |
|---|---|---|---|---|---|
| Patient-Weight(kg) | LessThan 0.97 * Healthy (74.7) [133] | 74.4 | -0.424% | >3% body weight lost from fluids | |
| BloodVolume(L) | LessThan Healthy (5.49) [254] | 5.11 | -6.82% | Decrease | |
| HeartRate(1/min) | GreaterThan Healthy (72.0) and LessThan 100 [254] [133] | 78.0 | 8.36% and -22.0% | Increase and <100 bpm | |
| PulsePressure(mmHg) | EqualTo Healthy (40.7) [133] | 33.9 | 18.2% | No Change | |
| CardiacOutput(L/min) | LessThanEqualTo Healthy (5.79) [133] [254] | 5.12 | -11.6% | No Change or Decrease | |
| CentralVenousPressure(mmHg) | LessThan Healthy (4.75) [254] | 4.13 | -13.1% | Decrease | |
| HeartStrokeVolume(mL) | LessThan Healthy (80.4) [254] | 65.6 | -18.4% | Decrease | |
| CoreTemperature(degC) | GreaterThan Healthy (37.0) [254] | 38.6 | 4.11% | Increase | |
| SweatRate(mg/min) | LessThan Healthy (331) [254] | 4.50e+03 | 1.26e+03% | Decrease | |
| PlasmaOsmolality(mOsm/kg) | GreaterThan Healthy (245) [254] | 258 | 5.04% | Increase | |
| Urinalysis-Color | EqualTo "Yellow" [183] | DarkYellow | Fail | Light Yellow | |
| MildDehydration-ActiveFraction | EqualTo 1.0 | 1.00 | 0.00% | ||
| MildDehydration-FinalState | EqualTo True | True | Pass |
 |
| Property Name | Engine Value |
|---|---|
| Patient-Weight(kg) | 74.4 |
| ECG-Lead3ElectricPotential(mV) | 0.191 |
| HeartRate(1/min) | 78.0 |
| HeartStrokeVolume(mL) | 65.6 |
| HeartEjectionFraction | 0.519 |
| BloodVolume(L) | 5.11 |
| ExtravascularFluidVolume(L) | 31.7 |
| ArterialPressure(mmHg) | 91.7 |
| MeanArterialPressure(mmHg) | 95.2 |
| SystolicArterialPressure(mmHg) | 111 |
| DiastolicArterialPressure(mmHg) | 77.3 |
| CardiacOutput(L/min) | 5.12 |
| HemoglobinContent(g) | 821 |
| CentralVenousPressure(mmHg) | 4.13 |
| PulmonaryCapillariesWedgePressure(mmHg) | 5.66 |
| TidalVolume(mL) | 568 |
| TotalLungVolume(mL) | 2.55e+03 |
| RespirationRate(1/min) | 12.6 |
| OxygenSaturation | 0.969 |
| CarbonDioxideSaturation | 0.0280 |
| EndTidalCarbonDioxideFraction | 0.0481 |
| EndTidalCarbonDioxidePressure(mmHg) | 36.5 |
| TotalAlveolarVentilation(L/min) | 7.16 |
| TranspulmonaryPressure(cmH2O) | 7.19 |
| CoreTemperature(degC) | 38.6 |
| SkinTemperature(degC) | 28.9 |
| RespiratoryExchangeRatio | 0.822 |
| OxygenConsumptionRate(mL/min) | 270 |
| CarbonDioxideProductionRate(mL/min) | 222 |
| GlomerularFiltrationRate(mL/min) | 52.8 |
| RenalBloodFlow(L/min) | 0.645 |
| UrineProductionRate(mL/min) | -2.85e-18 |
| LeftAfferentArterioleResistance(mmHg_min/mL) | 0.133 |
| RightAfferentArterioleResistance(mmHg_min/mL) | 0.133 |
| SystemicVascularResistance(mmHg_s/mL) | 1.07 |
| LeftAlveoli-Pressure(cmH2O) | 1.03e+03 |
| RightAlveoli-Pressure(cmH2O) | 1.03e+03 |
| Pericardium-Volume(mL) | 14.0 |
| Pericardium-Pressure(mmHg) | 0.990 |
| Carina-Oxygen-PartialPressure(mmHg) | 159 |
| Carina-CarbonDioxide-PartialPressure(mmHg) | 0.462 |
| LeftLungPulmonary-Oxygen-PartialPressure(mmHg) | 118 |
| RightLungPulmonary-Oxygen-PartialPressure(mmHg) | 115 |
| LeftLungPulmonary-CarbonDioxide-PartialPressure(mmHg) | 36.5 |
| RightLungPulmonary-CarbonDioxide-PartialPressure(mmHg) | 37.7 |
| LeftAlveoli-Oxygen-PartialPressure(mmHg) | 115 |
| LeftAlveoli-CarbonDioxide-PartialPressure(mmHg) | 38.3 |
| RightAlveoli-Oxygen-PartialPressure(mmHg) | 113 |
| RightAlveoli-CarbonDioxide-PartialPressure(mmHg) | 39.6 |
| Aorta-Oxygen-PartialPressure(mmHg) | 91.0 |
| Aorta-CarbonDioxide-PartialPressure(mmHg) | 39.8 |
| VenaCava-Oxygen-PartialPressure(mmHg) | 39.3 |
| VenaCava-CarbonDioxide-PartialPressure(mmHg) | 44.8 |
| RightTubules-Sodium-Concentration(g/L) | 7.89 |
| LeftTubules-Sodium-Concentration(g/L) | 7.89 |
| Oxygen-AlveolarTransfer(mL/min) | 277 |
| CarbonDioxide-AlveolarTransfer(mL/min) | -255 |
| Epinephrine-BloodConcentration(ug/L) | 0.0338 |
| Epinephrine-SystemicMassCleared(ug) | 3.60 |
| Norepinephrine-BloodConcentration(ug/L) | 0.232 |
| Norepinephrine-SystemicMassCleared(ug) | 12.8 |
| Patient-Weight(kg) | 74.4 |
| BloodPH | 7.42 |
| TotalFluidVolume(L) | 36.8 |
| ExtracellularFluidVolume(L) | 8.15 |
| IntracellularFluidVolume(L) | 23.6 |
| SweatRate(mg/min) | 4.50e+03 |
| MeanSkinFlow(L/min) | 0.272 |
| PulsePressure(mmHg) | 33.9 |
| PlasmaOsmolality(mOsm/kg) | 258 |
| PlasmaOsmolarity(mOsm/L) | 312 |
| UrineOsmolality(mOsm/kg) | 764 |
| UrineOsmolarity(mOsm/L) | 790 |
| UrinationRate(mL/s) | 0.00 |
| Bladder-Sodium-Concentration(g/L) | 5.38 |
| Bladder-Chloride-Concentration(g/L) | 5.97 |
| Bladder-Urea-Concentration(g/L) | 19.7 |
| Sodium-BloodConcentration(g/dL) | 0.352 |
| Sodium-MassInBody(mg) | 5.36e+04 |
| Sodium-MassInTissue(mg) | 3.56e+04 |
| Sodium-MassInBlood(mg) | 1.80e+04 |
| Chloride-BloodConcentration(ug/L) | 3.85e+06 |
| Chloride-MassInBody(mg) | 7.05e+04 |
| Chloride-MassInBlood(mg) | 1.97e+04 |
| Chloride-SystemicMassCleared(mg) | nan |
| Potassium-BloodConcentration(mg/dL) | 16.2 |
| Potassium-MassInBody(mg) | 9.61e+04 |
| Potassium-MassInTissue(mg) | 9.53e+04 |
| Potassium-MassInBlood(mg) | 829 |
| Calcium-BloodConcentration(mg/L) | 51.1 |
| Calcium-MassInBody(mg) | 673 |
| Calcium-MassInTissue(mg) | 411 |
| Calcium-MassInBlood(mg) | 262 |
| Lactate-BloodConcentration(mg/L) | 160 |
| Lactate-MassInBody(mg) | 1.07e+03 |
| Lactate-MassInTissue(mg) | 251 |
| Lactate-MassInBlood(mg) | 817 |
| Urea-BloodConcentration(mg/dL) | 38.0 |
| Urea-MassInBody(mg) | 1.18e+04 |
| Urea-MassInTissue(mg) | 9.83e+03 |
| Urea-MassInBlood(mg) | 1.94e+03 |
| ConvectiveHeatLoss(W) | 7.94 |
| ConvectiveHeatTranferCoefficient(W/m^2_K) | 2.59 |
| EvaporativeHeatLoss(W) | 108 |
| EvaporativeHeatTranferCoefficient(W/m^2_K) | 0.00217 |
| RadiativeHeatLoss(W) | 12.8 |
| RadiativeHeatTranferCoefficient(W/m^2_K) | 4.17 |
| RespirationHeatLoss(W) | 9.76 |
| SkinHeatLoss(W) | 20.7 |