Dehydration-Moderate
Moderate Dehydration
Description
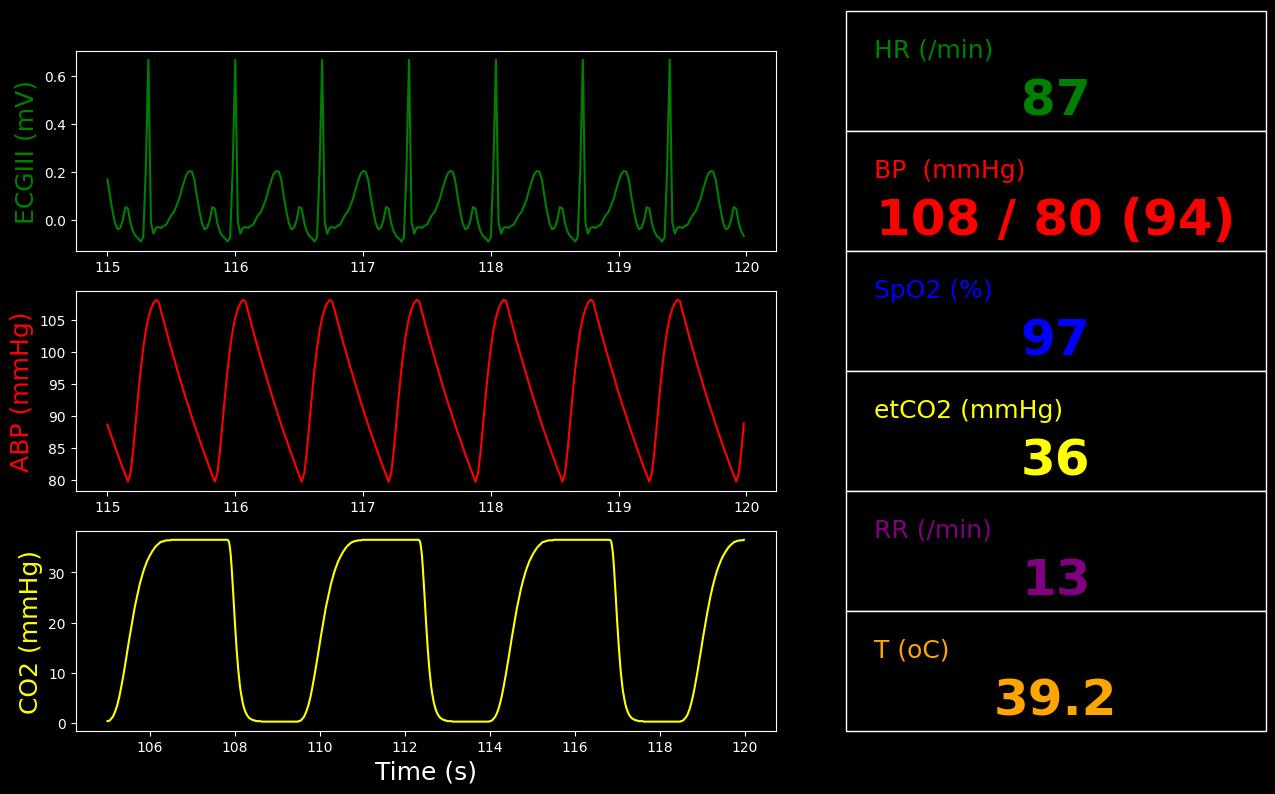
Moderately dehydrated patient from excessive sweating.
Segment Validation
Segment 1
| Property Name | Validation | Engine Value | Percent Error | Percent Change | Notes |
|---|---|---|---|---|---|
| Patient-Weight(kg) | LessThan 0.95 * Healthy (73.2) [133] | 72.1 | -1.51% | >5% body weight lost from fluids | |
| BloodVolume(L) | LessThan Segment1 (5.11) [254] | 4.75 | -7.05% | Decrease | |
| HeartRate(1/min) | GreaterThan Segment1 (78.0) and LessThan 100 [254] [133] | 87.3 | 11.9% and -12.7% | Increase and <100 bpm | |
| RespirationRate(1/min) | GreaterThan Healthy (12.0) [183] | 13.1 | 9.17% | Rapid breathing | |
| TidalVolume(mL) | GreaterThan Healthy (537) [183] | 595 | 10.8% | Deep breathing | |
| PulsePressure(mmHg) | EqualTo Segment1 (33.9) [133] | 28.4 | 17.7% | No Change | |
| CardiacOutput(L/min) | LessThanEqualTo Segment1 (5.12) [133] [254] | 4.66 | -8.86% | No Change or Decrease | |
| CentralVenousPressure(mmHg) | LessThan Segment1 (4.13) [254] | 3.70 | -10.2% | Decrease | |
| HeartStrokeVolume(mL) | LessThan Segment1 (65.6) [254] | 53.4 | -18.5% | Decrease | |
| CoreTemperature(degC) | GreaterThan Segment1 (38.6) [254] | 39.2 | 1.54% | Increase | |
| SweatRate(mg/min) | LessThan Segment1 (4.50e+03) [254] | 3.43e+03 | -23.9% | Decrease | |
| PlasmaOsmolality(mOsm/kg) | GreaterThan Segment1 (258) [254] | 268 | 3.86% | Increase | |
| Urinalysis-Color | EqualTo "DarkYellow" [183] | Yellow | Fail | Dark Yellow | |
| ModerateDehydration-ActiveFraction | EqualTo 1.0 | 1.00 | 0.00% | ||
| ModerateDehydration-FinalState | EqualTo True | True | Pass |
 |
| Property Name | Engine Value |
|---|---|
| Patient-Weight(kg) | 72.1 |
| ECG-Lead3ElectricPotential(mV) | -0.00757 |
| HeartRate(1/min) | 87.3 |
| HeartStrokeVolume(mL) | 53.4 |
| HeartEjectionFraction | 0.472 |
| BloodVolume(L) | 4.75 |
| ExtravascularFluidVolume(L) | 29.6 |
| ArterialPressure(mmHg) | 107 |
| MeanArterialPressure(mmHg) | 94.5 |
| SystolicArterialPressure(mmHg) | 108 |
| DiastolicArterialPressure(mmHg) | 79.7 |
| CardiacOutput(L/min) | 4.66 |
| HemoglobinContent(g) | 821 |
| CentralVenousPressure(mmHg) | 3.70 |
| PulmonaryCapillariesWedgePressure(mmHg) | 5.00 |
| TidalVolume(mL) | 595 |
| TotalLungVolume(mL) | 2.26e+03 |
| RespirationRate(1/min) | 13.1 |
| OxygenSaturation | 0.966 |
| CarbonDioxideSaturation | 0.0278 |
| EndTidalCarbonDioxideFraction | 0.0479 |
| EndTidalCarbonDioxidePressure(mmHg) | 36.4 |
| TotalAlveolarVentilation(L/min) | 7.80 |
| TranspulmonaryPressure(cmH2O) | 4.79 |
| CoreTemperature(degC) | 39.2 |
| SkinTemperature(degC) | 30.8 |
| RespiratoryExchangeRatio | 0.819 |
| OxygenConsumptionRate(mL/min) | 292 |
| CarbonDioxideProductionRate(mL/min) | 239 |
| GlomerularFiltrationRate(mL/min) | 59.7 |
| RenalBloodFlow(L/min) | 0.623 |
| UrineProductionRate(mL/min) | -1.02e-16 |
| LeftAfferentArterioleResistance(mmHg_min/mL) | 0.187 |
| RightAfferentArterioleResistance(mmHg_min/mL) | 0.187 |
| SystemicVascularResistance(mmHg_s/mL) | 1.17 |
| LeftAlveoli-Pressure(cmH2O) | 1.03e+03 |
| RightAlveoli-Pressure(cmH2O) | 1.03e+03 |
| Pericardium-Volume(mL) | 13.0 |
| Pericardium-Pressure(mmHg) | 0.980 |
| Carina-Oxygen-PartialPressure(mmHg) | 118 |
| Carina-CarbonDioxide-PartialPressure(mmHg) | 36.3 |
| LeftLungPulmonary-Oxygen-PartialPressure(mmHg) | 117 |
| RightLungPulmonary-Oxygen-PartialPressure(mmHg) | 115 |
| LeftLungPulmonary-CarbonDioxide-PartialPressure(mmHg) | 37.4 |
| RightLungPulmonary-CarbonDioxide-PartialPressure(mmHg) | 38.7 |
| LeftAlveoli-Oxygen-PartialPressure(mmHg) | 117 |
| LeftAlveoli-CarbonDioxide-PartialPressure(mmHg) | 37.4 |
| RightAlveoli-Oxygen-PartialPressure(mmHg) | 115 |
| RightAlveoli-CarbonDioxide-PartialPressure(mmHg) | 38.8 |
| Aorta-Oxygen-PartialPressure(mmHg) | 90.3 |
| Aorta-CarbonDioxide-PartialPressure(mmHg) | 39.7 |
| VenaCava-Oxygen-PartialPressure(mmHg) | 38.6 |
| VenaCava-CarbonDioxide-PartialPressure(mmHg) | 45.2 |
| RightTubules-Sodium-Concentration(g/L) | 14.1 |
| LeftTubules-Sodium-Concentration(g/L) | 14.1 |
| Oxygen-AlveolarTransfer(mL/min) | 321 |
| CarbonDioxide-AlveolarTransfer(mL/min) | -250 |
| Epinephrine-BloodConcentration(ug/L) | 0.0338 |
| Epinephrine-SystemicMassCleared(ug) | 2.18 |
| Norepinephrine-BloodConcentration(ug/L) | 0.228 |
| Norepinephrine-SystemicMassCleared(ug) | 7.57 |
| Patient-Weight(kg) | 72.1 |
| BloodPH | 7.42 |
| TotalFluidVolume(L) | 34.3 |
| ExtracellularFluidVolume(L) | 7.62 |
| IntracellularFluidVolume(L) | 22.0 |
| SweatRate(mg/min) | 3.43e+03 |
| MeanSkinFlow(L/min) | 0.252 |
| PulsePressure(mmHg) | 28.4 |
| PlasmaOsmolality(mOsm/kg) | 268 |
| PlasmaOsmolarity(mOsm/L) | 329 |
| UrineOsmolality(mOsm/kg) | 730 |
| UrineOsmolarity(mOsm/L) | 755 |
| UrinationRate(mL/s) | 0.00 |
| Bladder-Sodium-Concentration(g/L) | 4.60 |
| Bladder-Chloride-Concentration(g/L) | 5.01 |
| Bladder-Urea-Concentration(g/L) | 21.4 |
| Sodium-BloodConcentration(g/dL) | 0.373 |
| Sodium-MassInBody(mg) | 5.17e+04 |
| Sodium-MassInTissue(mg) | 3.40e+04 |
| Sodium-MassInBlood(mg) | 1.77e+04 |
| Chloride-BloodConcentration(ug/L) | 4.10e+06 |
| Chloride-MassInBody(mg) | 6.77e+04 |
| Chloride-MassInBlood(mg) | 1.95e+04 |
| Chloride-SystemicMassCleared(mg) | nan |
| Potassium-BloodConcentration(mg/dL) | 16.9 |
| Potassium-MassInBody(mg) | 9.57e+04 |
| Potassium-MassInTissue(mg) | 9.49e+04 |
| Potassium-MassInBlood(mg) | 805 |
| Calcium-BloodConcentration(mg/L) | 54.6 |
| Calcium-MassInBody(mg) | 663 |
| Calcium-MassInTissue(mg) | 403 |
| Calcium-MassInBlood(mg) | 260 |
| Lactate-BloodConcentration(mg/L) | 171 |
| Lactate-MassInBody(mg) | 1.05e+03 |
| Lactate-MassInTissue(mg) | 234 |
| Lactate-MassInBlood(mg) | 812 |
| Urea-BloodConcentration(mg/dL) | 37.7 |
| Urea-MassInBody(mg) | 1.16e+04 |
| Urea-MassInTissue(mg) | 9.83e+03 |
| Urea-MassInBlood(mg) | 1.79e+03 |
| ConvectiveHeatLoss(W) | 10.2 |
| ConvectiveHeatTranferCoefficient(W/m^2_K) | 2.59 |
| EvaporativeHeatLoss(W) | 105 |
| EvaporativeHeatTranferCoefficient(W/m^2_K) | 0.00217 |
| RadiativeHeatLoss(W) | 16.5 |
| RadiativeHeatTranferCoefficient(W/m^2_K) | 4.21 |
| RespirationHeatLoss(W) | 10.7 |
| SkinHeatLoss(W) | 26.7 |