Dehydration-Severe
Severe Dehydration
Description
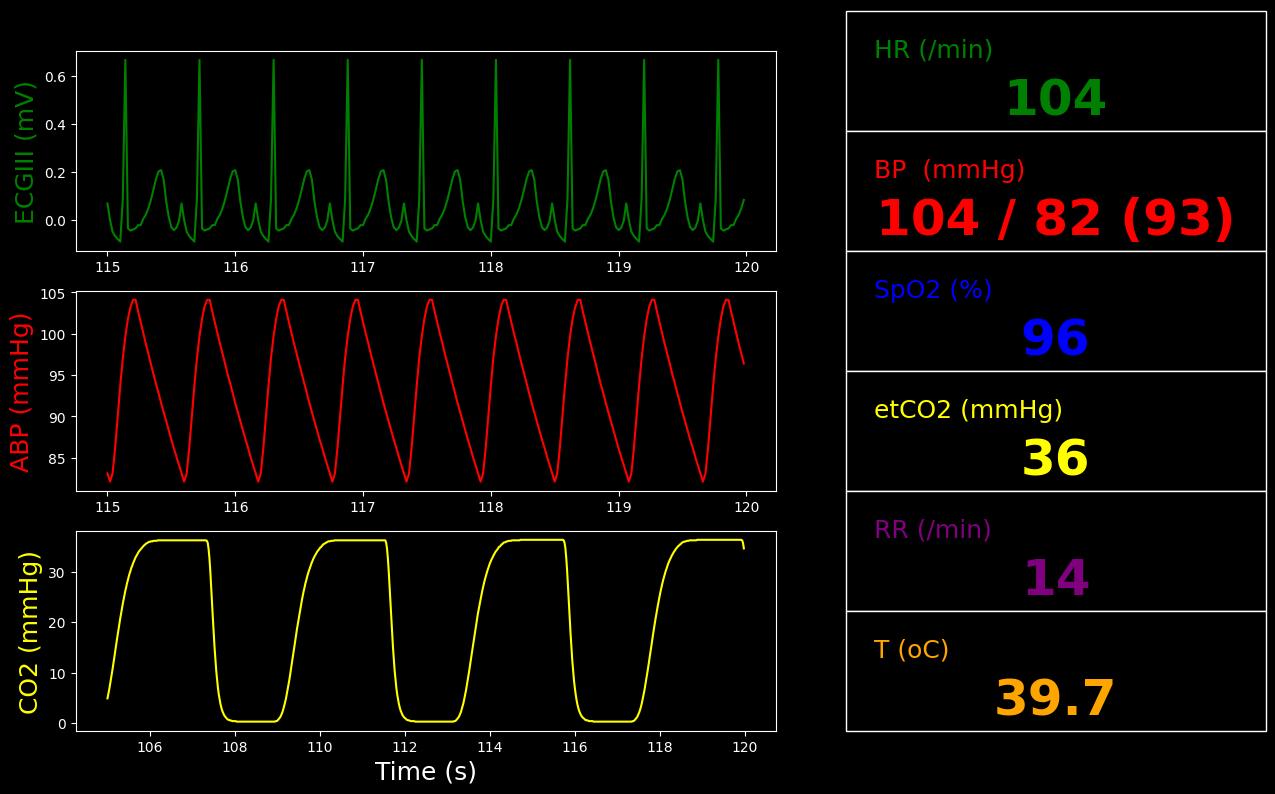
Severely dehydrated patient from excessive sweating.
Segment Validation
Segment 1
| Property Name | Validation | Engine Value | Percent Error | Percent Change | Notes |
|---|---|---|---|---|---|
| Patient-Weight(kg) | LessThan 0.9 * Healthy (69.3) [133] | 68.9 | -0.652% | >10% body weight lost from fluids | |
| BloodVolume(L) | LessThan Segment1 (4.75) [254] | 4.27 | -10.1% | Decrease | |
| HeartRate(1/min) | GreaterThan Segment1 (87.3) and GreaterThan 100 [254] [133] [218] | 104 | 19.5% and 4.28% | Increase and Tachycardia and Fast | |
| RespirationRate(1/min) | GreaterThan Segment1 (13.1) [183] [133] | 13.8 | 5.53% | Increase | |
| TidalVolume(mL) | GreaterThan Segment1 (595) [218] | 640 | 7.48% | Deep breathing | |
| PulsePressure(mmHg) | LessThan Healthy (40.7) [133] | 22.0 | -45.9% | Narrow | |
| SystolicArterialPressure(mmHg) | LessThan Healthy (114) [183] | 104 | -8.90% | Decrease or Low | |
| CardiacOutput(L/min) | LessThan Segment1 (4.66) [133] [254] | 4.23 | -9.24% | Decrease | |
| CentralVenousPressure(mmHg) | LessThan Segment1 (3.70) [254] | 3.22 | -13.0% | Decrease | |
| HeartStrokeVolume(mL) | LessThan Segment1 (53.4) [254] | 40.6 | -24.0% | Decrease | |
| CoreTemperature(degC) | GreaterThan Segment1 (39.2) [254] | 39.8 | 1.55% | Increase | |
| SweatRate(mg/min) | LessThan Segment1 (3.43e+03) [254] [133] | 1.97e+03 | -42.4% | Decrease | |
| PlasmaOsmolality(mOsm/kg) | GreaterThan Segment1 (268) [254] | 283 | 5.61% | Increase | |
| Urinalysis-Color | EqualTo "DarkYellow" or EqualTo "Brown" [183] [133] | DarkYellow | Pass | Dark Yellow to Brown | |
| SevereDehydration-ActiveFraction | EqualTo 1.0 | 1.00 | 0.00% | ||
| SevereDehydration-FinalState | EqualTo True | True | Pass |
 |
| Property Name | Engine Value |
|---|---|
| Patient-Weight(kg) | 68.9 |
| ECG-Lead3ElectricPotential(mV) | 0.0223 |
| HeartRate(1/min) | 104 |
| HeartStrokeVolume(mL) | 40.6 |
| HeartEjectionFraction | 0.411 |
| BloodVolume(L) | 4.27 |
| ExtravascularFluidVolume(L) | 26.7 |
| ArterialPressure(mmHg) | 98.8 |
| MeanArterialPressure(mmHg) | 93.4 |
| SystolicArterialPressure(mmHg) | 104 |
| DiastolicArterialPressure(mmHg) | 82.1 |
| CardiacOutput(L/min) | 4.23 |
| HemoglobinContent(g) | 821 |
| CentralVenousPressure(mmHg) | 3.22 |
| PulmonaryCapillariesWedgePressure(mmHg) | 4.26 |
| TidalVolume(mL) | 640 |
| TotalLungVolume(mL) | 2.76e+03 |
| RespirationRate(1/min) | 13.8 |
| OxygenSaturation | 0.959 |
| CarbonDioxideSaturation | 0.0276 |
| EndTidalCarbonDioxideFraction | 0.0478 |
| EndTidalCarbonDioxidePressure(mmHg) | 36.3 |
| TotalAlveolarVentilation(L/min) | 8.85 |
| TranspulmonaryPressure(cmH2O) | 8.15 |
| CoreTemperature(degC) | 39.8 |
| SkinTemperature(degC) | 31.5 |
| RespiratoryExchangeRatio | 0.811 |
| OxygenConsumptionRate(mL/min) | 344 |
| CarbonDioxideProductionRate(mL/min) | 279 |
| GlomerularFiltrationRate(mL/min) | 63.6 |
| RenalBloodFlow(L/min) | 0.550 |
| UrineProductionRate(mL/min) | -1.37e-16 |
| LeftAfferentArterioleResistance(mmHg_min/mL) | 0.187 |
| RightAfferentArterioleResistance(mmHg_min/mL) | 0.187 |
| SystemicVascularResistance(mmHg_s/mL) | 1.28 |
| LeftAlveoli-Pressure(cmH2O) | 1.03e+03 |
| RightAlveoli-Pressure(cmH2O) | 1.03e+03 |
| Pericardium-Volume(mL) | 11.7 |
| Pericardium-Pressure(mmHg) | 0.967 |
| Carina-Oxygen-PartialPressure(mmHg) | 160 |
| Carina-CarbonDioxide-PartialPressure(mmHg) | 0.307 |
| LeftLungPulmonary-Oxygen-PartialPressure(mmHg) | 121 |
| RightLungPulmonary-Oxygen-PartialPressure(mmHg) | 118 |
| LeftLungPulmonary-CarbonDioxide-PartialPressure(mmHg) | 33.9 |
| RightLungPulmonary-CarbonDioxide-PartialPressure(mmHg) | 35.4 |
| LeftAlveoli-Oxygen-PartialPressure(mmHg) | 119 |
| LeftAlveoli-CarbonDioxide-PartialPressure(mmHg) | 35.7 |
| RightAlveoli-Oxygen-PartialPressure(mmHg) | 116 |
| RightAlveoli-CarbonDioxide-PartialPressure(mmHg) | 37.3 |
| Aorta-Oxygen-PartialPressure(mmHg) | 87.5 |
| Aorta-CarbonDioxide-PartialPressure(mmHg) | 39.8 |
| VenaCava-Oxygen-PartialPressure(mmHg) | 36.7 |
| VenaCava-CarbonDioxide-PartialPressure(mmHg) | 45.9 |
| RightTubules-Sodium-Concentration(g/L) | 32.9 |
| LeftTubules-Sodium-Concentration(g/L) | 32.9 |
| Oxygen-AlveolarTransfer(mL/min) | 397 |
| CarbonDioxide-AlveolarTransfer(mL/min) | -344 |
| Epinephrine-BloodConcentration(ug/L) | 0.0341 |
| Epinephrine-SystemicMassCleared(ug) | 2.26 |
| Norepinephrine-BloodConcentration(ug/L) | 0.238 |
| Norepinephrine-SystemicMassCleared(ug) | 7.86 |
| Patient-Weight(kg) | 68.9 |
| BloodPH | 7.42 |
| TotalFluidVolume(L) | 31.0 |
| ExtracellularFluidVolume(L) | 6.90 |
| IntracellularFluidVolume(L) | 19.8 |
| SweatRate(mg/min) | 1.97e+03 |
| MeanSkinFlow(L/min) | 0.222 |
| PulsePressure(mmHg) | 22.0 |
| PlasmaOsmolality(mOsm/kg) | 283 |
| PlasmaOsmolarity(mOsm/L) | 354 |
| UrineOsmolality(mOsm/kg) | 801 |
| UrineOsmolarity(mOsm/L) | 831 |
| UrinationRate(mL/s) | 0.00 |
| Bladder-Sodium-Concentration(g/L) | 5.02 |
| Bladder-Chloride-Concentration(g/L) | 5.44 |
| Bladder-Urea-Concentration(g/L) | 23.8 |
| Sodium-BloodConcentration(g/dL) | 0.410 |
| Sodium-MassInBody(mg) | 4.97e+04 |
| Sodium-MassInTissue(mg) | 3.22e+04 |
| Sodium-MassInBlood(mg) | 1.75e+04 |
| Chloride-BloodConcentration(ug/L) | 4.52e+06 |
| Chloride-MassInBody(mg) | 6.47e+04 |
| Chloride-MassInBlood(mg) | 1.93e+04 |
| Chloride-SystemicMassCleared(mg) | nan |
| Potassium-BloodConcentration(mg/dL) | 18.2 |
| Potassium-MassInBody(mg) | 9.53e+04 |
| Potassium-MassInTissue(mg) | 9.45e+04 |
| Potassium-MassInBlood(mg) | 779 |
| Calcium-BloodConcentration(mg/L) | 60.2 |
| Calcium-MassInBody(mg) | 651 |
| Calcium-MassInTissue(mg) | 393 |
| Calcium-MassInBlood(mg) | 257 |
| Lactate-BloodConcentration(mg/L) | 192 |
| Lactate-MassInBody(mg) | 1.03e+03 |
| Lactate-MassInTissue(mg) | 215 |
| Lactate-MassInBlood(mg) | 819 |
| Urea-BloodConcentration(mg/dL) | 42.5 |
| Urea-MassInBody(mg) | 1.16e+04 |
| Urea-MassInTissue(mg) | 9.82e+03 |
| Urea-MassInBlood(mg) | 1.82e+03 |
| ConvectiveHeatLoss(W) | 11.0 |
| ConvectiveHeatTranferCoefficient(W/m^2_K) | 2.59 |
| EvaporativeHeatLoss(W) | 65.6 |
| EvaporativeHeatTranferCoefficient(W/m^2_K) | 0.00217 |
| RadiativeHeatLoss(W) | 17.9 |
| RadiativeHeatTranferCoefficient(W/m^2_K) | 4.22 |
| RespirationHeatLoss(W) | 12.3 |
| SkinHeatLoss(W) | 28.9 |