
Anemia
Anemia
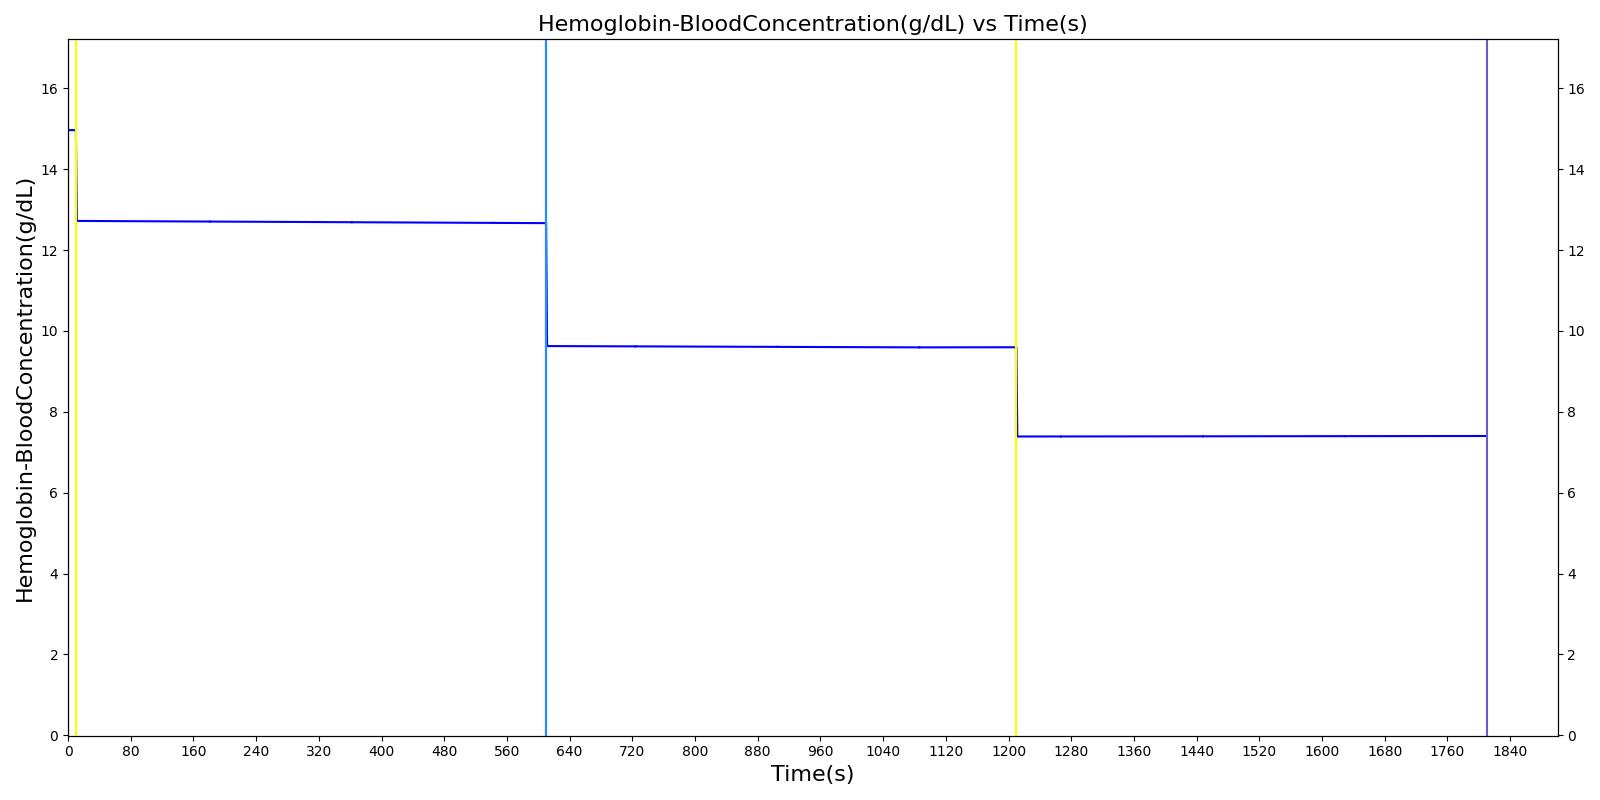
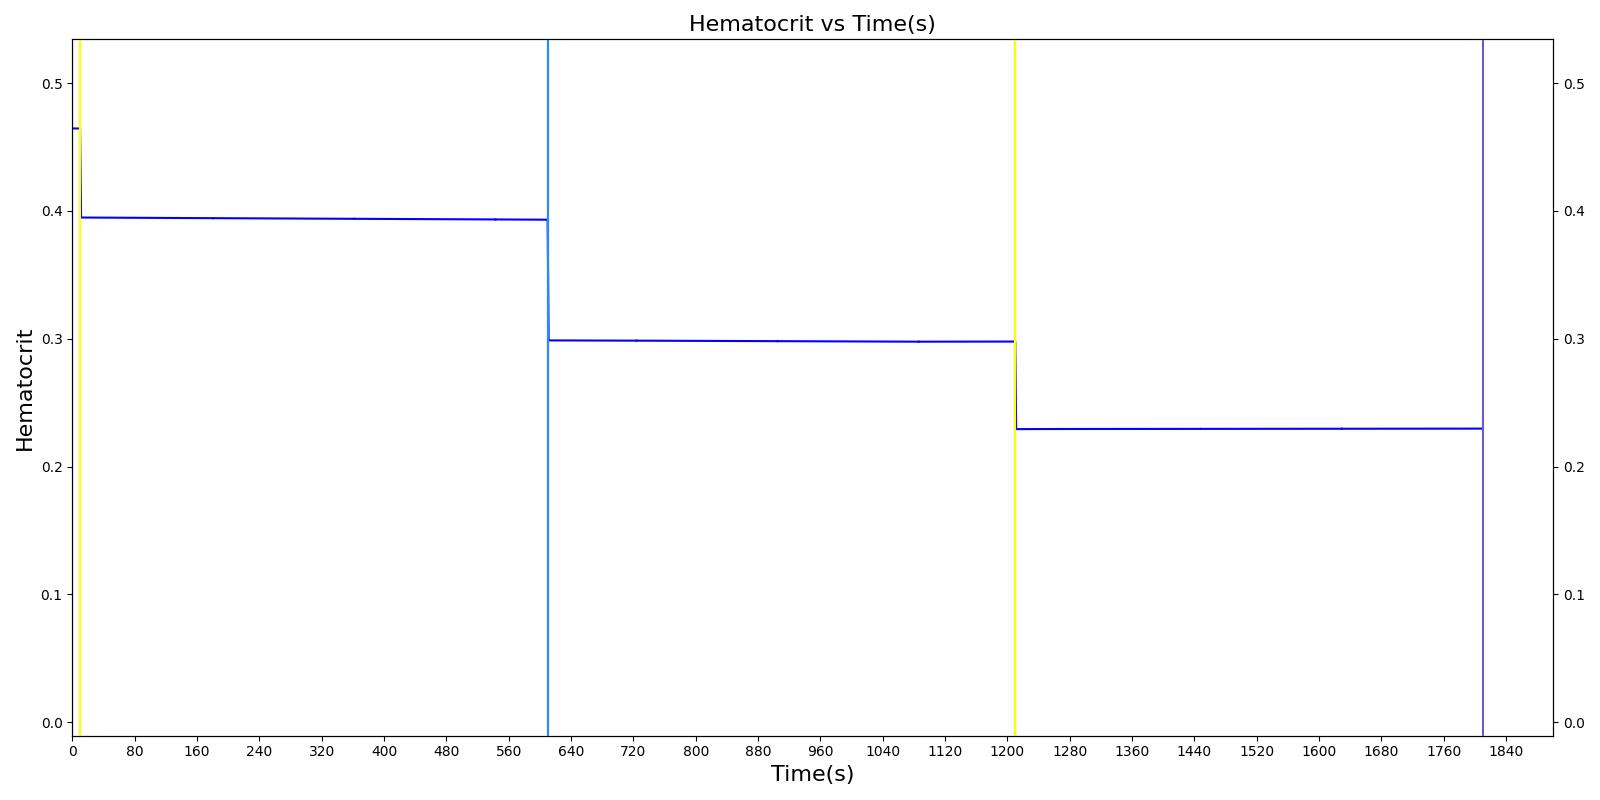
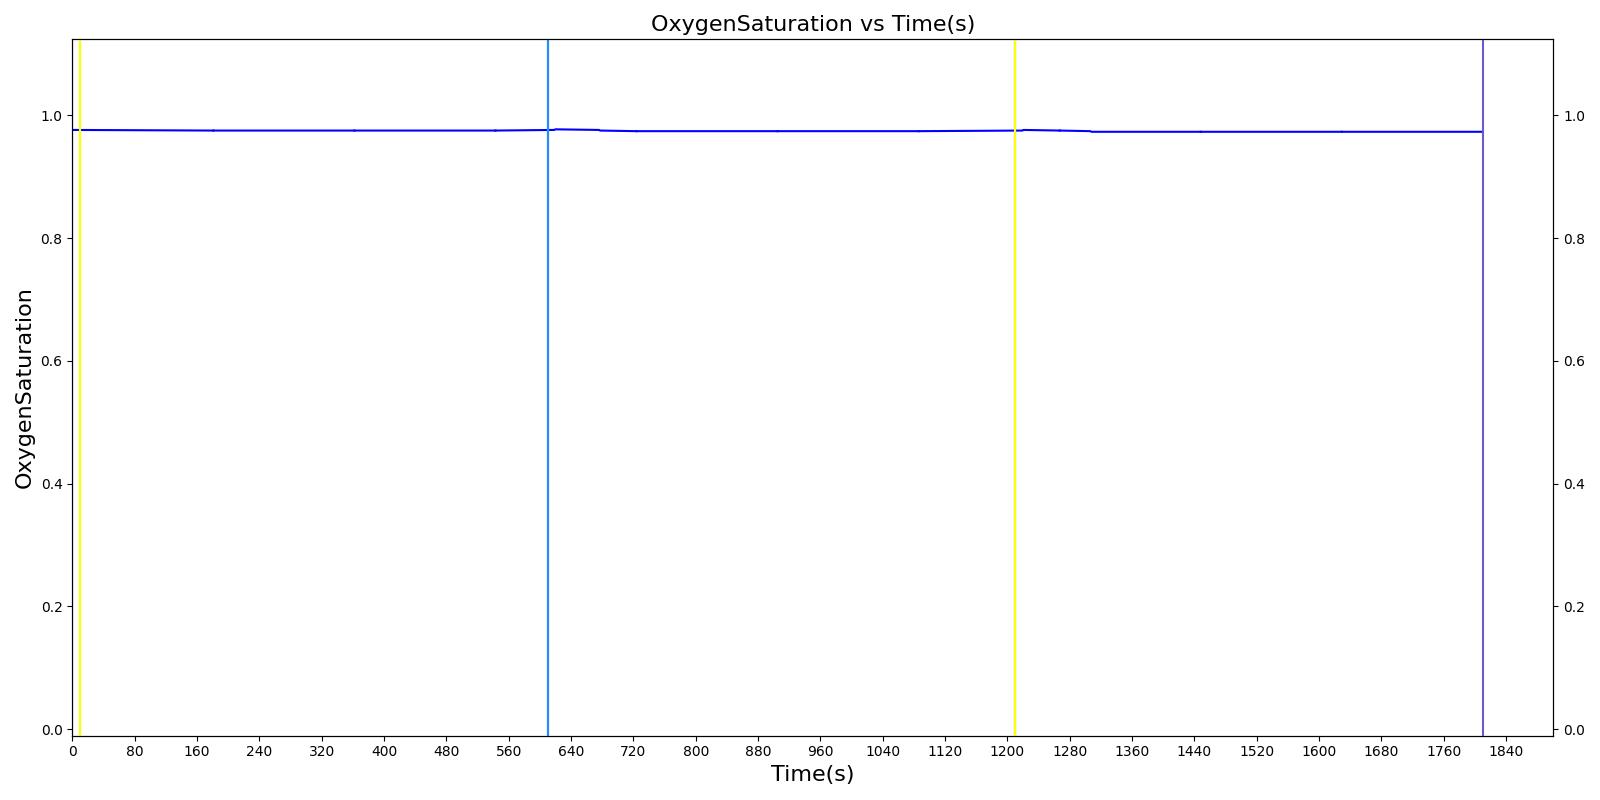
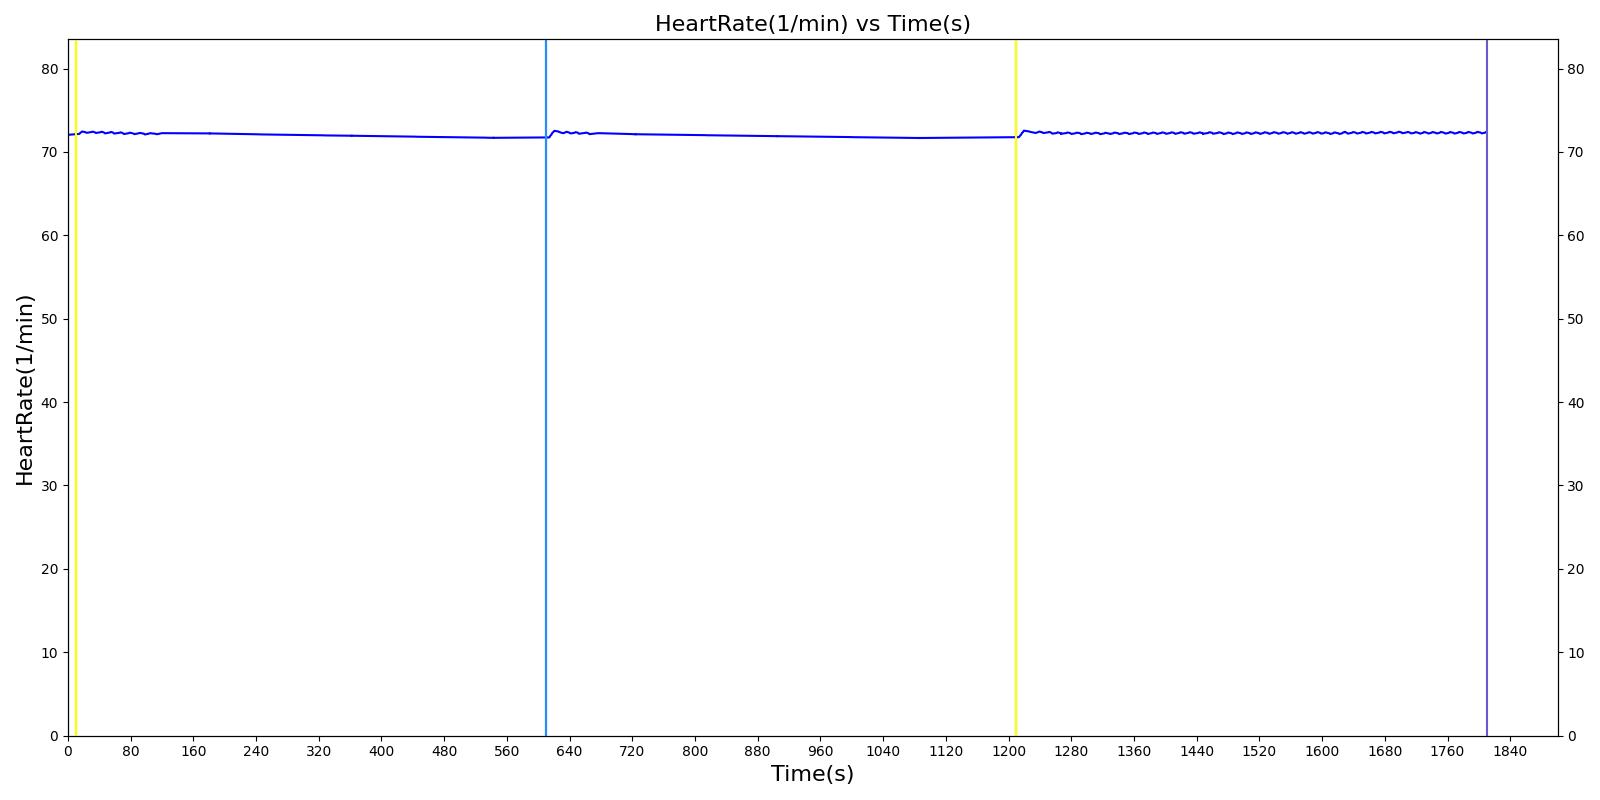
The anemia chronic condition and acute action are both validated below.
Chronic Anemia
Description
Chronic anemia with 30% reduction in hemoglobin content.
| Property Name | Validation | Engine Value | Percent Error | Percent Change | Notes |
|---|---|---|---|---|---|
| Hemoglobin-BloodConcentration(g/dL) | EqualTo 0.7 * Healthy Baseline (10.5) | 10.5 | -0.09% | Calculated from the Reduction Factor | |
| Hematocrit | EqualTo 0.7 * Healthy Baseline (0.325) [157] | 0.325 | -0.09% | Tracks Hb reduction | |
| HeartRate(1/min) | GreaterThan Healthy Baseline (72.0) [383] | 71.9 | -0.17% | Increase | |
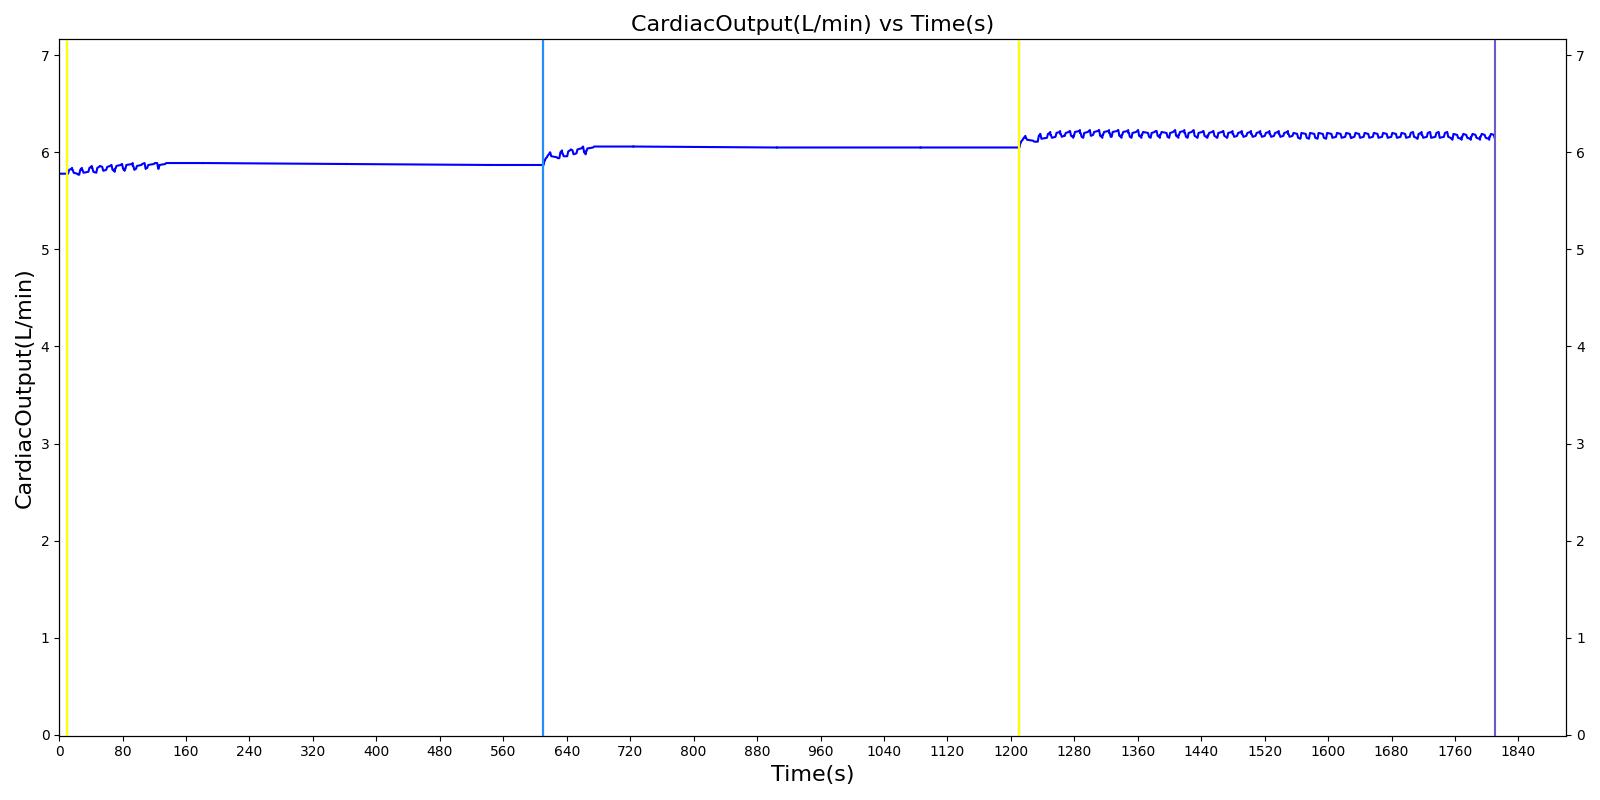
| CardiacOutput(L/min) | GreaterThan Healthy Baseline (5.78) [96] | 5.97 | 3.25% | Slight Increase | |
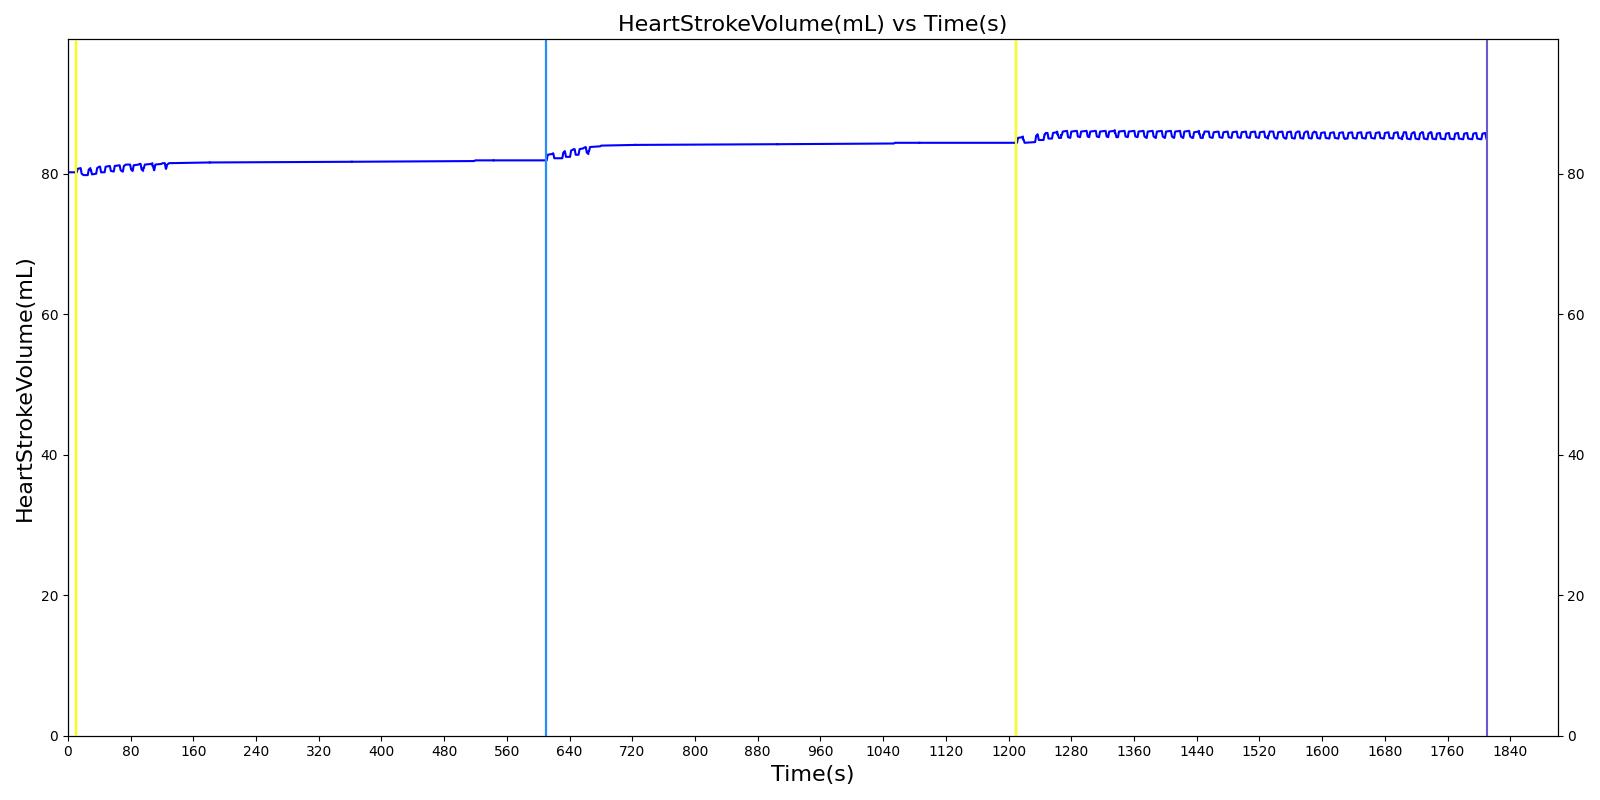
| HeartStrokeVolume(mL) | GreaterThan Healthy Baseline (80.2) [96] | 83.0 | 3.43% | Slight Increase | |
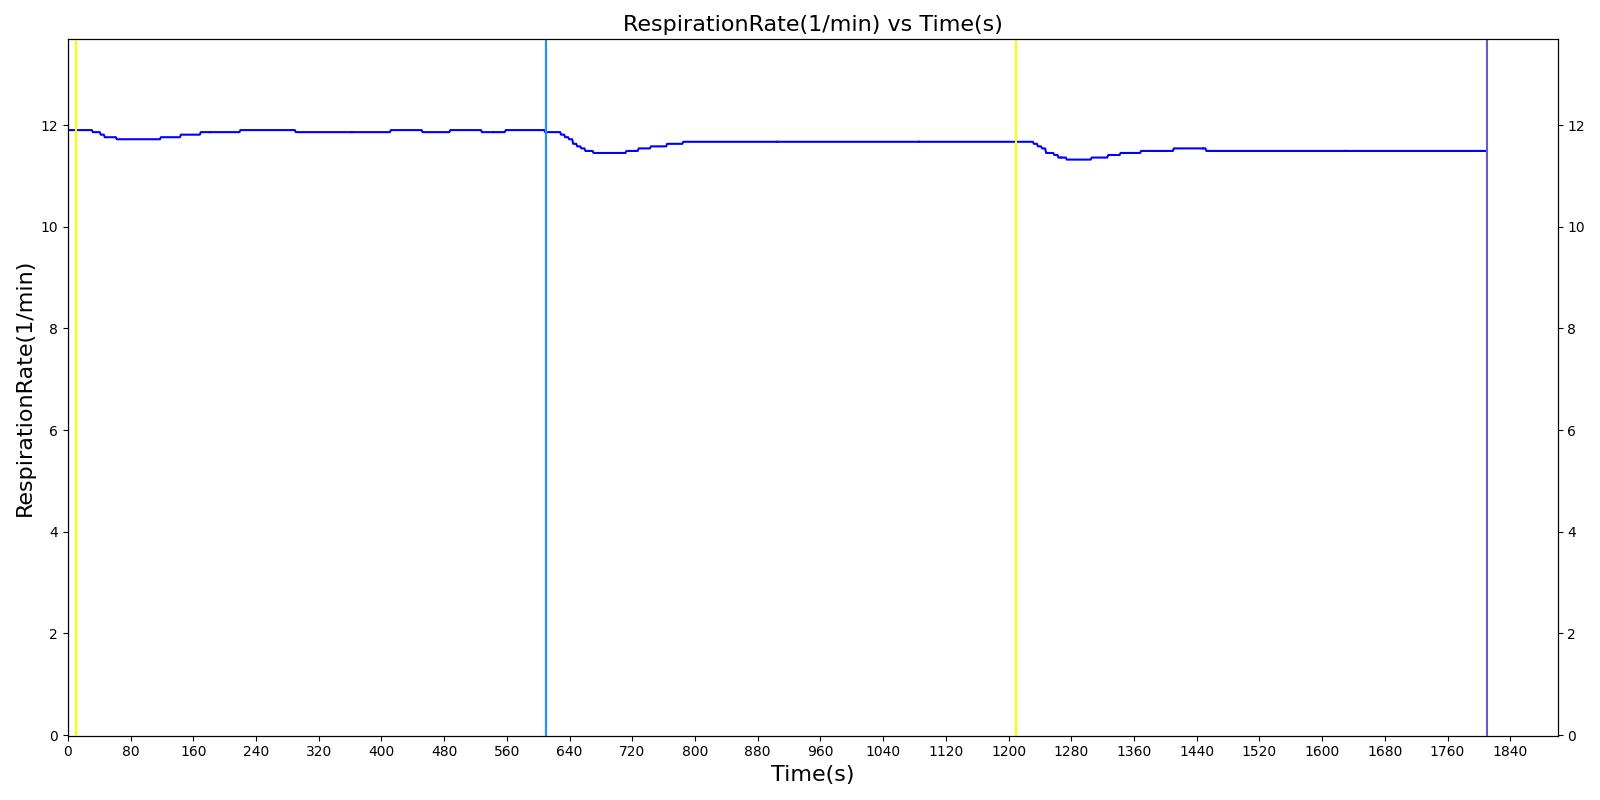
| RespirationRate(1/min) | EqualTo Healthy Baseline (11.9) [383] | 11.8 | -1.18% | No Change | |
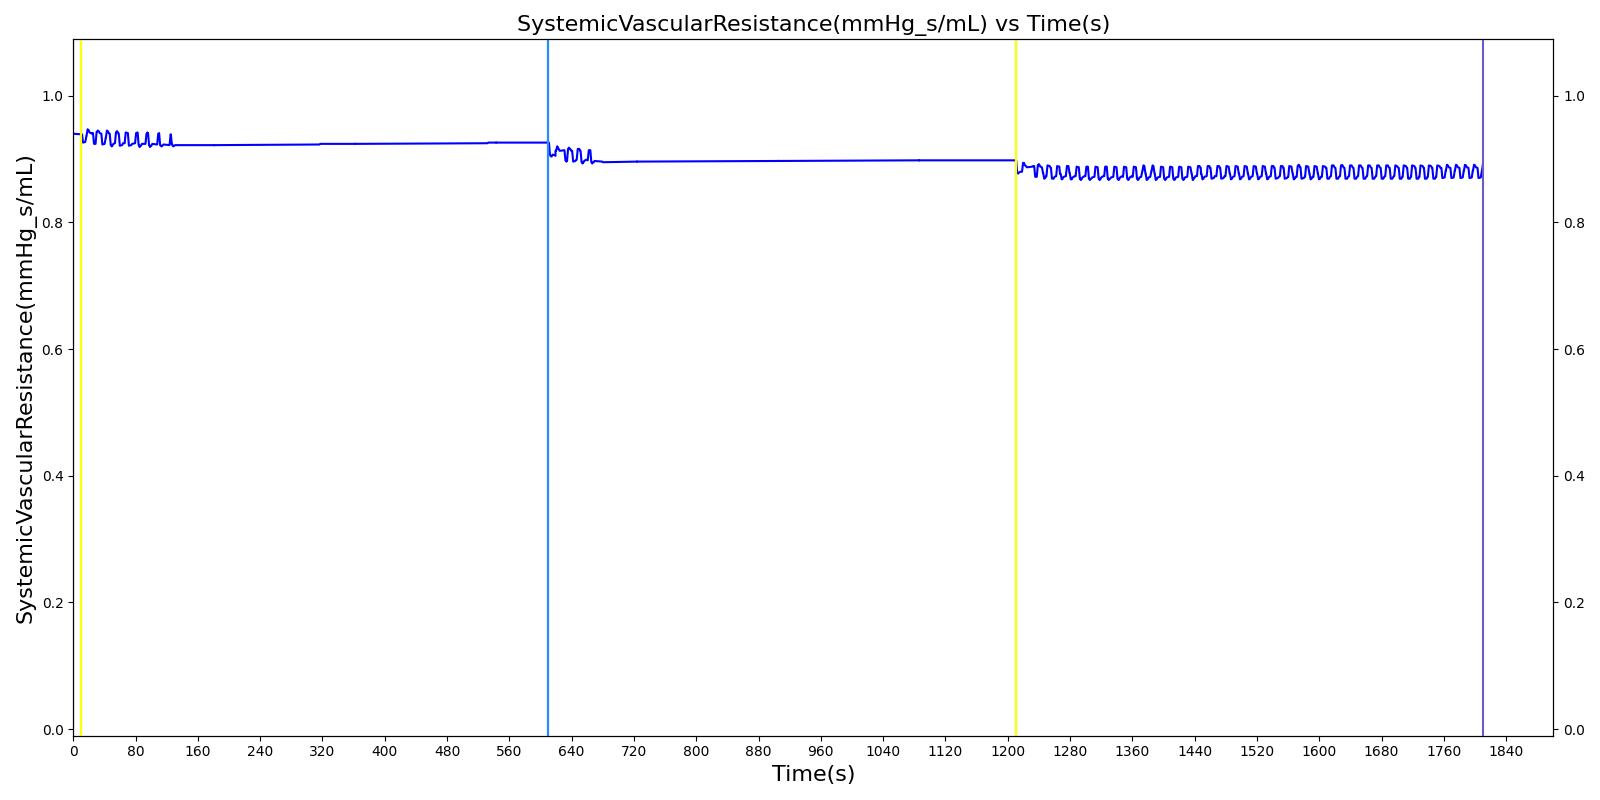
| SystemicVascularResistance(mmHg_s/mL) | LessThan Healthy Baseline (0.940) [157] | 0.906 | -3.63% | Decrease | |
| OxygenSaturation | EqualTo 0.945 [96] | 0.974 | 3.10% | ||
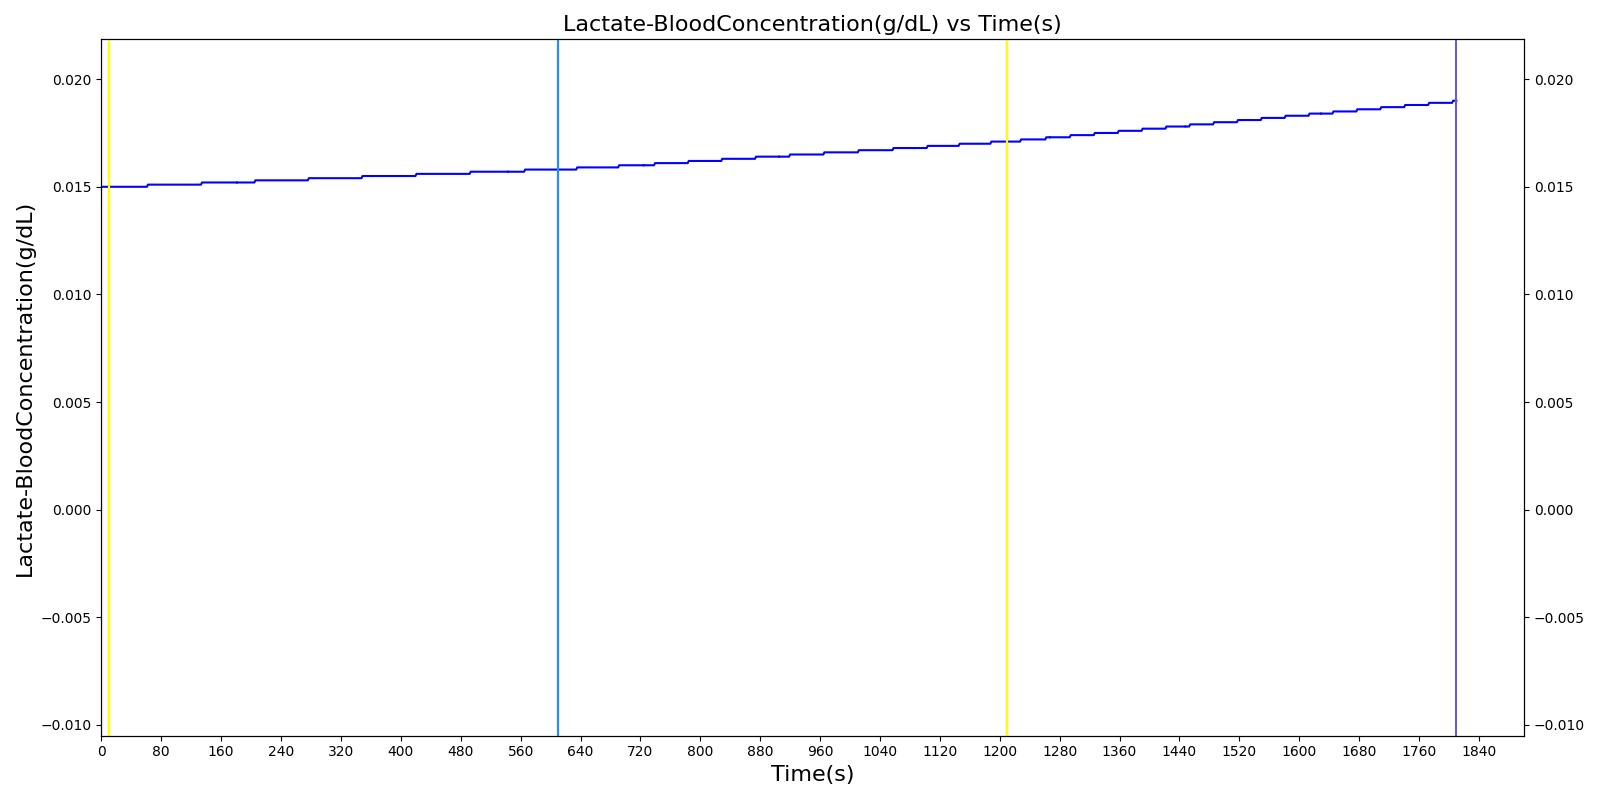
| Lactate-BloodConcentration(g/dL) | EqualTo Healthy Baseline (0.0150) [414] | 0.0155 | 3.34% | Normal for compensated anemia |
Acute Anemia
Description
Acute anemia with increasing severities from mild to moderate to severe.
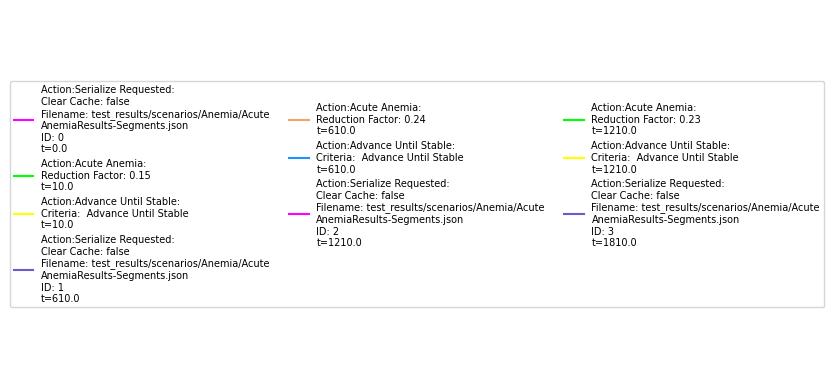
Mild anemia (total reduction factor = 0.15).
| Property Name | Validation | Engine Value | Percent Error | Percent Change | Notes |
|---|---|---|---|---|---|
| Hemoglobin-BloodConcentration(g/dL) | EqualTo 0.85 * Healthy Baseline (12.7) | 12.7 | -0.44% | Calculated from the Reduction Factor | |
| Hematocrit | EqualTo 0.85 * Healthy Baseline (0.395) [157] | 0.393 | -0.44% | Tracks Hb reduction | |
| HeartRate(1/min) | EqualTo 1.10 * Healthy Baseline (79.3) [414] | 71.6 | -9.65% | Increase with anemia (compensatory) | |
| CardiacOutput(L/min) | EqualTo 1.15 * Healthy Baseline (6.65) [414] | 5.87 | -11.74% | Rise with decreased SVR | |
| HeartStrokeVolume(mL) | GreaterThanEqualTo Healthy Baseline (80.2) [414] | 81.9 | 2.13% | Unchanged to slightly increased | |
| RespirationRate(1/min) | EqualTo Healthy Baseline (11.9) [157] | 11.9 | -0.40% | Minimal change | |
| SystemicVascularResistance(mmHg_s/mL) | EqualTo 0.90 * Healthy Baseline (0.846) [157] | 0.926 | 9.47% | Falls with reduced viscosity/vasodilation | |
| OxygenSaturation | EqualTo Healthy Baseline (0.976) [414] | 0.975 | -0.06% | SpO2 near-normal | |
| Lactate-BloodConcentration(g/dL) | EqualTo Healthy Baseline (0.0150) [414] | 0.0158 | 5.60% | Normal for compensated anemia |
Moderate anemia (total reduction factor = 0.35).
| Property Name | Validation | Engine Value | Percent Error | Percent Change | Notes |
|---|---|---|---|---|---|
| Hemoglobin-BloodConcentration(g/dL) | EqualTo 0.65 * Healthy Baseline (9.73) | 9.60 | -1.35% | Calculated from the Reduction Factor | |
| Hematocrit | EqualTo 0.65 * Healthy Baseline (0.302) [157] | 0.298 | -1.35% | Tracks Hb reduction | |
| HeartRate(1/min) | EqualTo 1.25 * Healthy Baseline (90.1) [414] | 71.7 | -20.38% | Tachycardia intensifies | |
| CardiacOutput(L/min) | EqualTo 1.35 * Healthy Baseline (7.80) [414] | 6.05 | -22.47% | CO increases further | |
| HeartStrokeVolume(mL) | GreaterThanEqualTo Healthy Baseline (80.2) [414] | 84.4 | 5.16% | Unchanged to slightly increased | |
| RespirationRate(1/min) | EqualTo 1.05 * Healthy Baseline (12.5) [157] | 11.7 | -6.61% | Small rise possible | |
| SystemicVascularResistance(mmHg_s/mL) | EqualTo 0.80 * Healthy Baseline (0.752) [157] | 0.898 | 19.40% | Further fall in SVR | |
| OxygenSaturation | EqualTo Healthy Baseline (0.976) [414] | 0.974 | -0.16% | SpO2 near-normal | |
| Lactate-BloodConcentration(g/dL) | EqualTo Healthy Baseline (0.0150) [414] | 0.0171 | 14.22% | Normal for compensated anemia |
Severe anemia (total reduction factor = 0.5).
| Property Name | Validation | Engine Value | Percent Error | Percent Change | Notes |
|---|---|---|---|---|---|
| Hemoglobin-BloodConcentration(g/dL) | EqualTo 0.50 * Healthy Baseline (7.48) | 7.40 | -1.09% | Calculated from the Reduction Factor | |
| Hematocrit | EqualTo 0.50 * Healthy Baseline (0.232) [157] | 0.230 | -1.09% | Tracks Hb reduction | |
| HeartRate(1/min) | EqualTo 1.35 * Healthy Baseline (97.3) [414] | 72.4 | -25.53% | Marked tachycardia | |
| CardiacOutput(L/min) | EqualTo 1.50 * Healthy Baseline (8.67) [414] | 6.15 | -29.07% | High-output state | |
| HeartStrokeVolume(mL) | GreaterThanEqualTo Healthy Baseline (80.2) [414] | 84.9 | 5.82% | Unchanged to slightly increased | |
| RespirationRate(1/min) | EqualTo 1.10 * Healthy Baseline (13.1) [157] | 11.5 | -12.23% | Augmented ventilatory drive | |
| SystemicVascularResistance(mmHg_s/mL) | EqualTo 0.70 * Healthy Baseline (0.658) [157] | 0.891 | 35.43% | Pronounced fall in SVR | |
| OxygenSaturation | EqualTo Healthy Baseline (0.976) [414] | 0.973 | -0.26% | SpO2 near-normal | |
| Lactate-BloodConcentration(g/dL) | EqualTo Healthy Baseline (0.0150) [414] | 0.0190 | 26.68% | Normal for compensated anemia |
 |
 |
 |
 |
 |
 |
 |
 |
 |
|
 |
|